SIP vs Lump Sum: ₹10 Lakh in Nifty 50 and Nifty Next 50
Ten years of Nifty 50 and Nifty Next 50 daily closes: the same ₹10 lakh through a monthly SIP against buying every 10%, 20% and 30% fall. Full trade logs.
In this post we compare two ways of putting the same ₹10 lakh into an index fund, and see how each one behaves. The first is a monthly SIP. The second is holding the money back and buying only when the market falls. We run both on two of India's biggest indices — the Nifty 50 and the Nifty Next 50 — using ten years of daily closing prices.
Here is exactly what is being compared. Both investors have ₹10 lakh in hand on day one, neither earns anything on the money not yet invested, and both are counted on the same day at the end.
- Monthly SIP — ₹8,333 invested on the first trading day of every month, for ten years.
- Buying the dip — ₹1 lakh when the index is 10% below its peak, ₹2 lakh more if it falls to 20%, and ₹3 lakh more if it falls to 30%, then stop. A fall that goes all the way to 30% therefore uses ₹6 lakh.
We use index closing values rather than a particular index fund's NAV, because most index funds do not have ten years of history and we would lose the long view.
This is the first article in the SIP vs lump sum series. We picked these two indices because they are the most widely followed: the Nifty 50 is India's top 50 companies by market value, and the Nifty Next 50 is the group just below it. Along the way we also compare a SIP in the Nifty 50 against a SIP in the Nifty Next 50, each index's SIP against its own dip plan, and the two indices' dip plans against each other.
New to these two indices? Start with Nifty 50 vs Nifty Next 50: which index should you pick, then come back here for the results.
The two indices over the last ten years
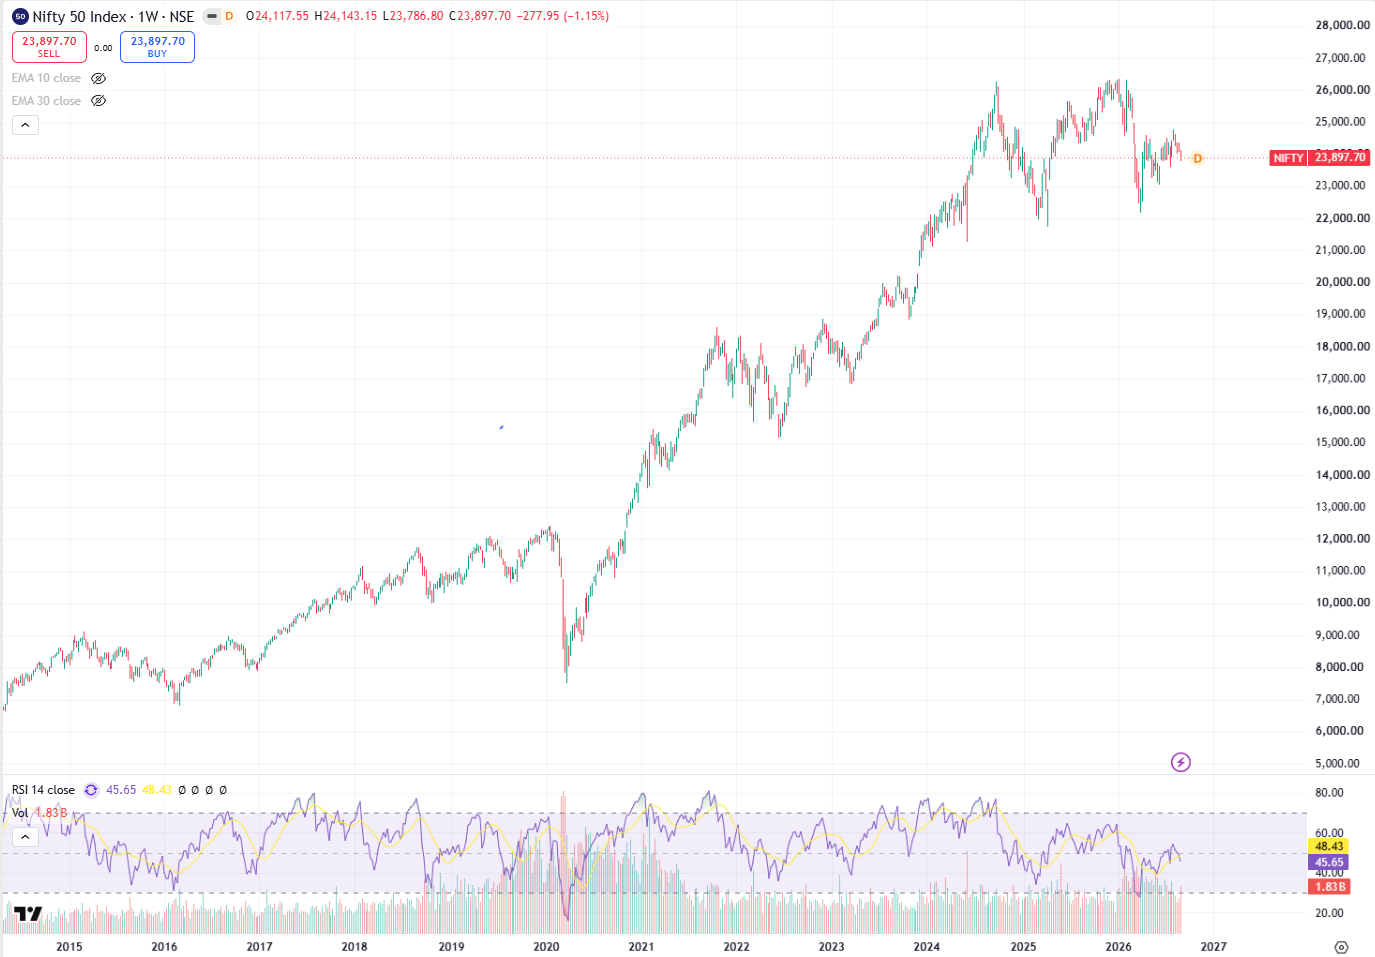
Here is what the period we are testing looks like. Both charts are weekly candles covering roughly 2015 to 2026.
Nifty 50 — weekly chart
Nifty Next 50 — weekly chart
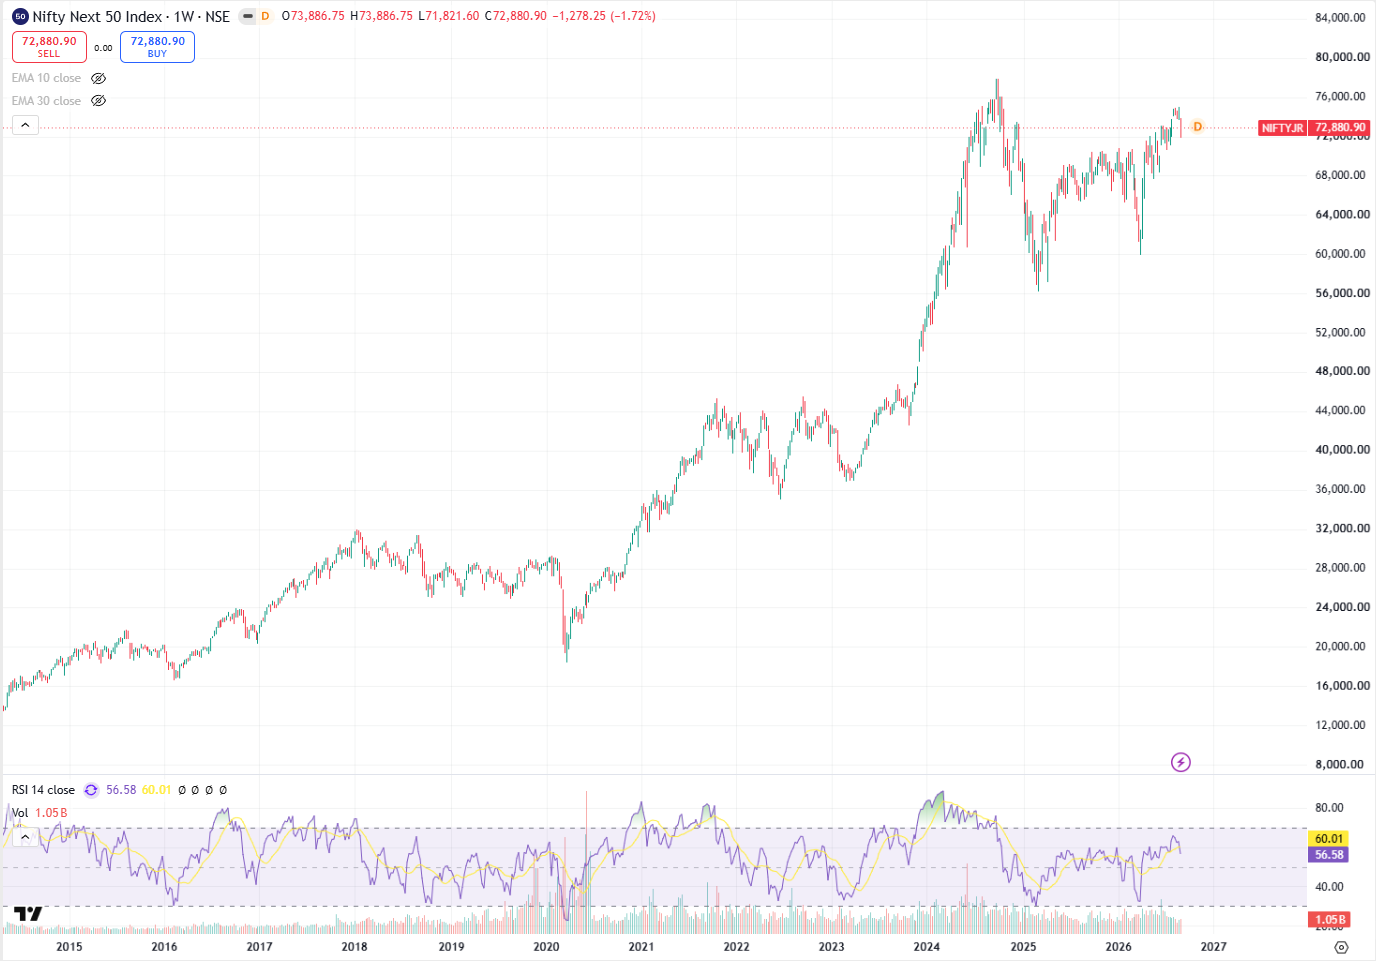
The Nifty Next 50 climbed further over the decade, but it also fell harder. That difference drives almost everything that follows.
How the test is set up
| Item | Setting |
|---|---|
| Period | 6 September 2016 to 4 September 2026 |
| Trading sessions | 2,479 per index |
| Starting money | ₹10,00,000 in hand on day one, for both |
| SIP | ₹8,333 on the first trading day of each month, 120 installments |
| First buy | ₹1,00,000 when the index is 10% below its peak |
| Second buy | ₹2,00,000 more when it is 20% below |
| Third buy | ₹3,00,000 more when it is 30% below, then stop |
| Buying again | All three buys become available again only after the index sets a new all-time high |
| Uninvested money | Earns nothing, for both strategies |
| Prices | Daily closing values of the index |
One fall can therefore take at most ₹6 lakh, and the plan then sits out the rest of that decline however deep it goes. The other ₹4 lakh waits for the index to reach a new high and fall again. The SIP puts in ₹9,99,960 rather than a round ₹10 lakh, because 120 installments of ₹8,333 fall ₹40 short.
Nifty 50: what happened
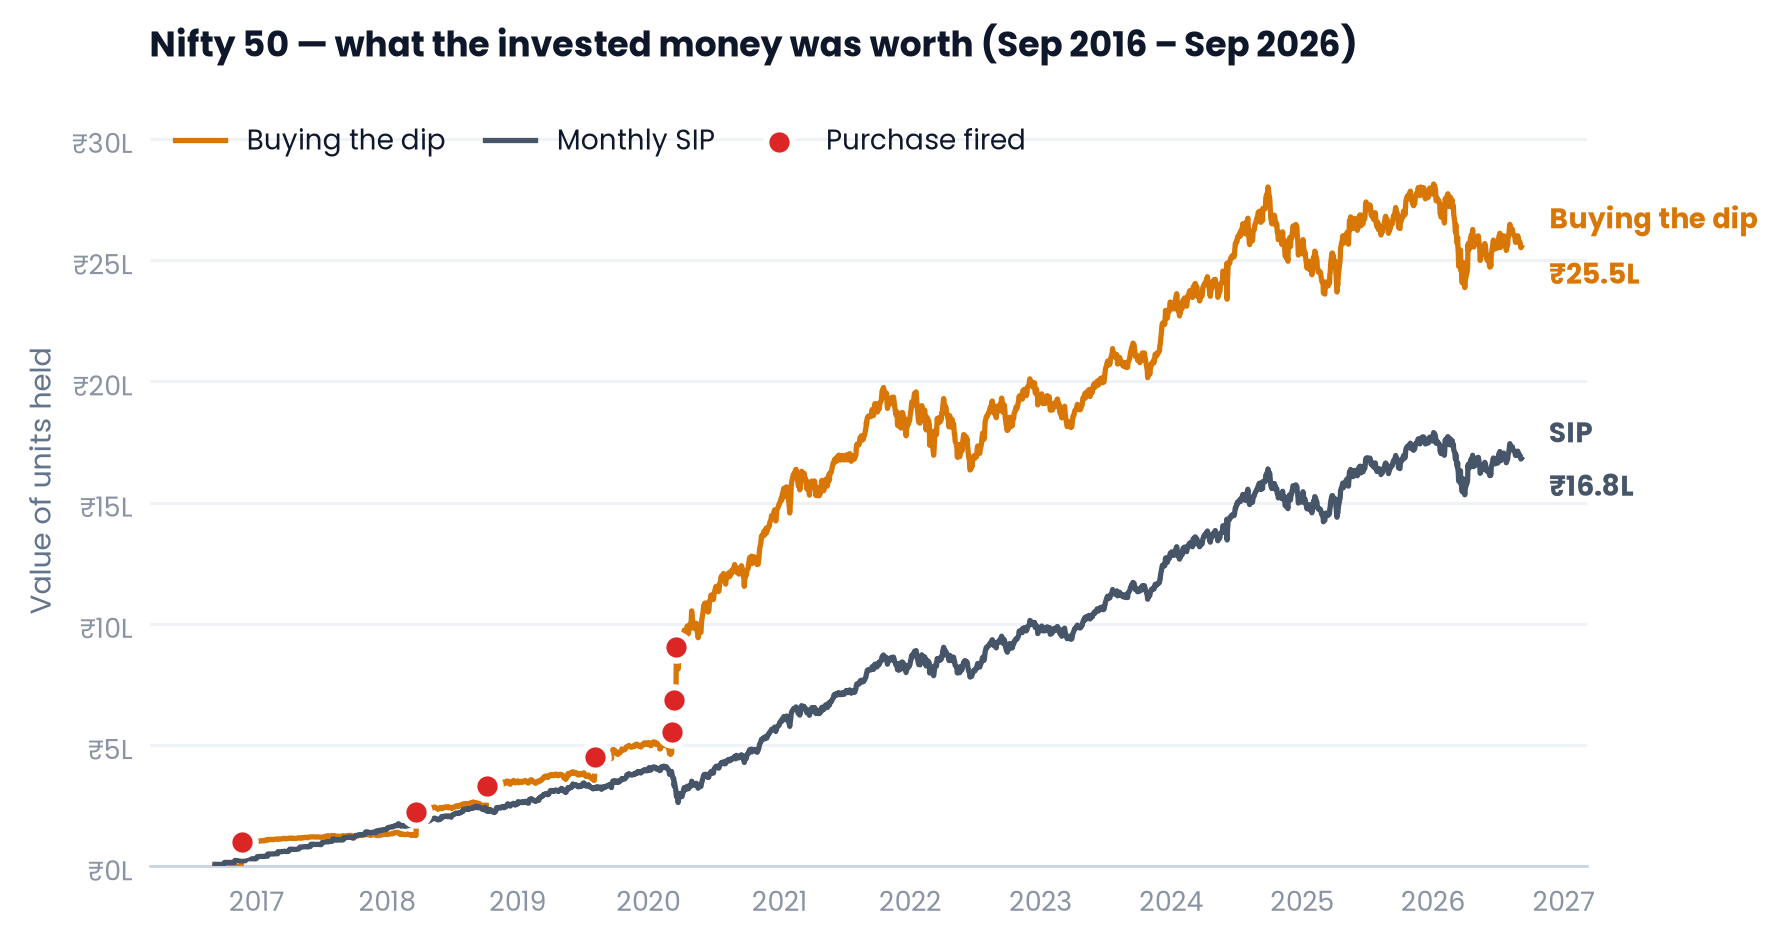
Both lines start at zero and show only what the invested money is worth. The SIP climbs in a smooth ramp; the dip line steps up at each purchase, and in between simply rides the index with no new money going in.
| Strategy | Invested | Final value | Total gain |
|---|---|---|---|
| Monthly SIP | ₹9,99,960 | ₹16,82,016 | +68.20% |
| Buying the dip | ₹10,00,000 | ₹25,54,459 | +155.45% |
Buying the dip finished with ₹25.54 lakh against the SIP's ₹16.82 lakh — a gain of 155.45% against 68.20% on the same ₹10 lakh.
Nifty Next 50: what happened
| Strategy | Invested | Final value | Total gain |
|---|---|---|---|
| Monthly SIP | ₹9,99,960 | ₹20,13,008 | +101.30% |
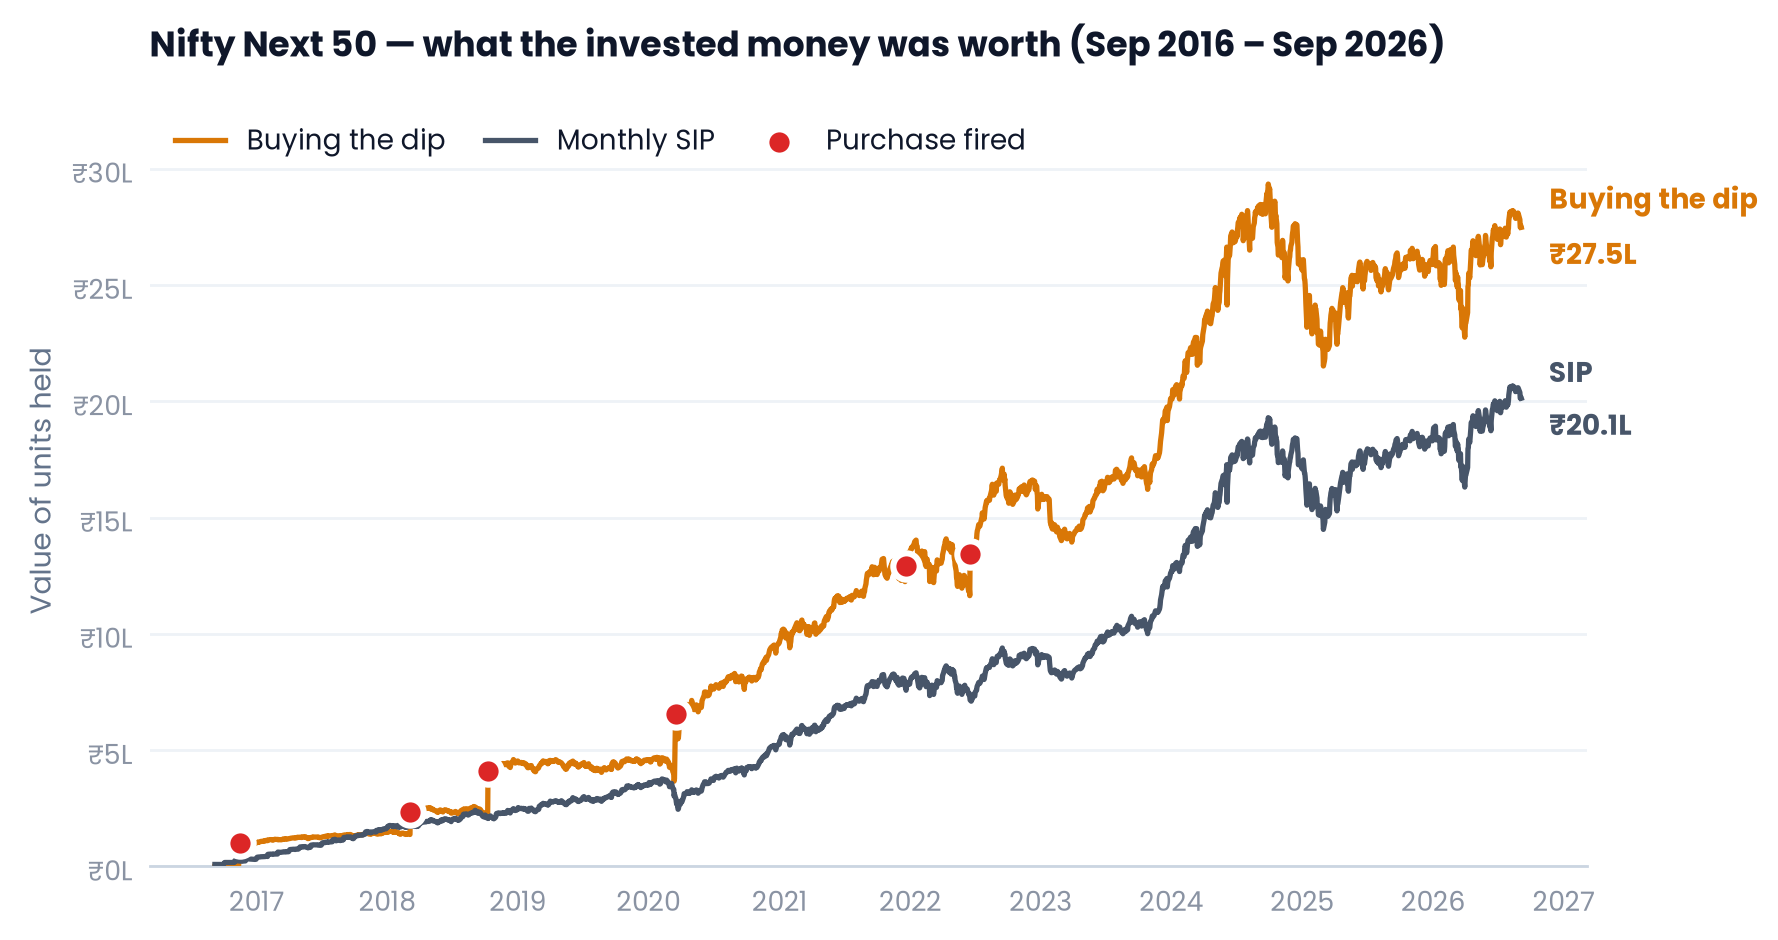
| Buying the dip | ₹10,00,000 | ₹27,47,637 | +174.76% |
The same result by a narrower margin: 174.76% against 101.30%. The gap is smaller here because the dip plan finished deploying much later — its last ₹3 lakh went in during December 2021 and June 2022, at index levels around half where it ended — so its price advantage was 26.7% rather than the Nifty 50's 34.2%.
Where the dip money actually went
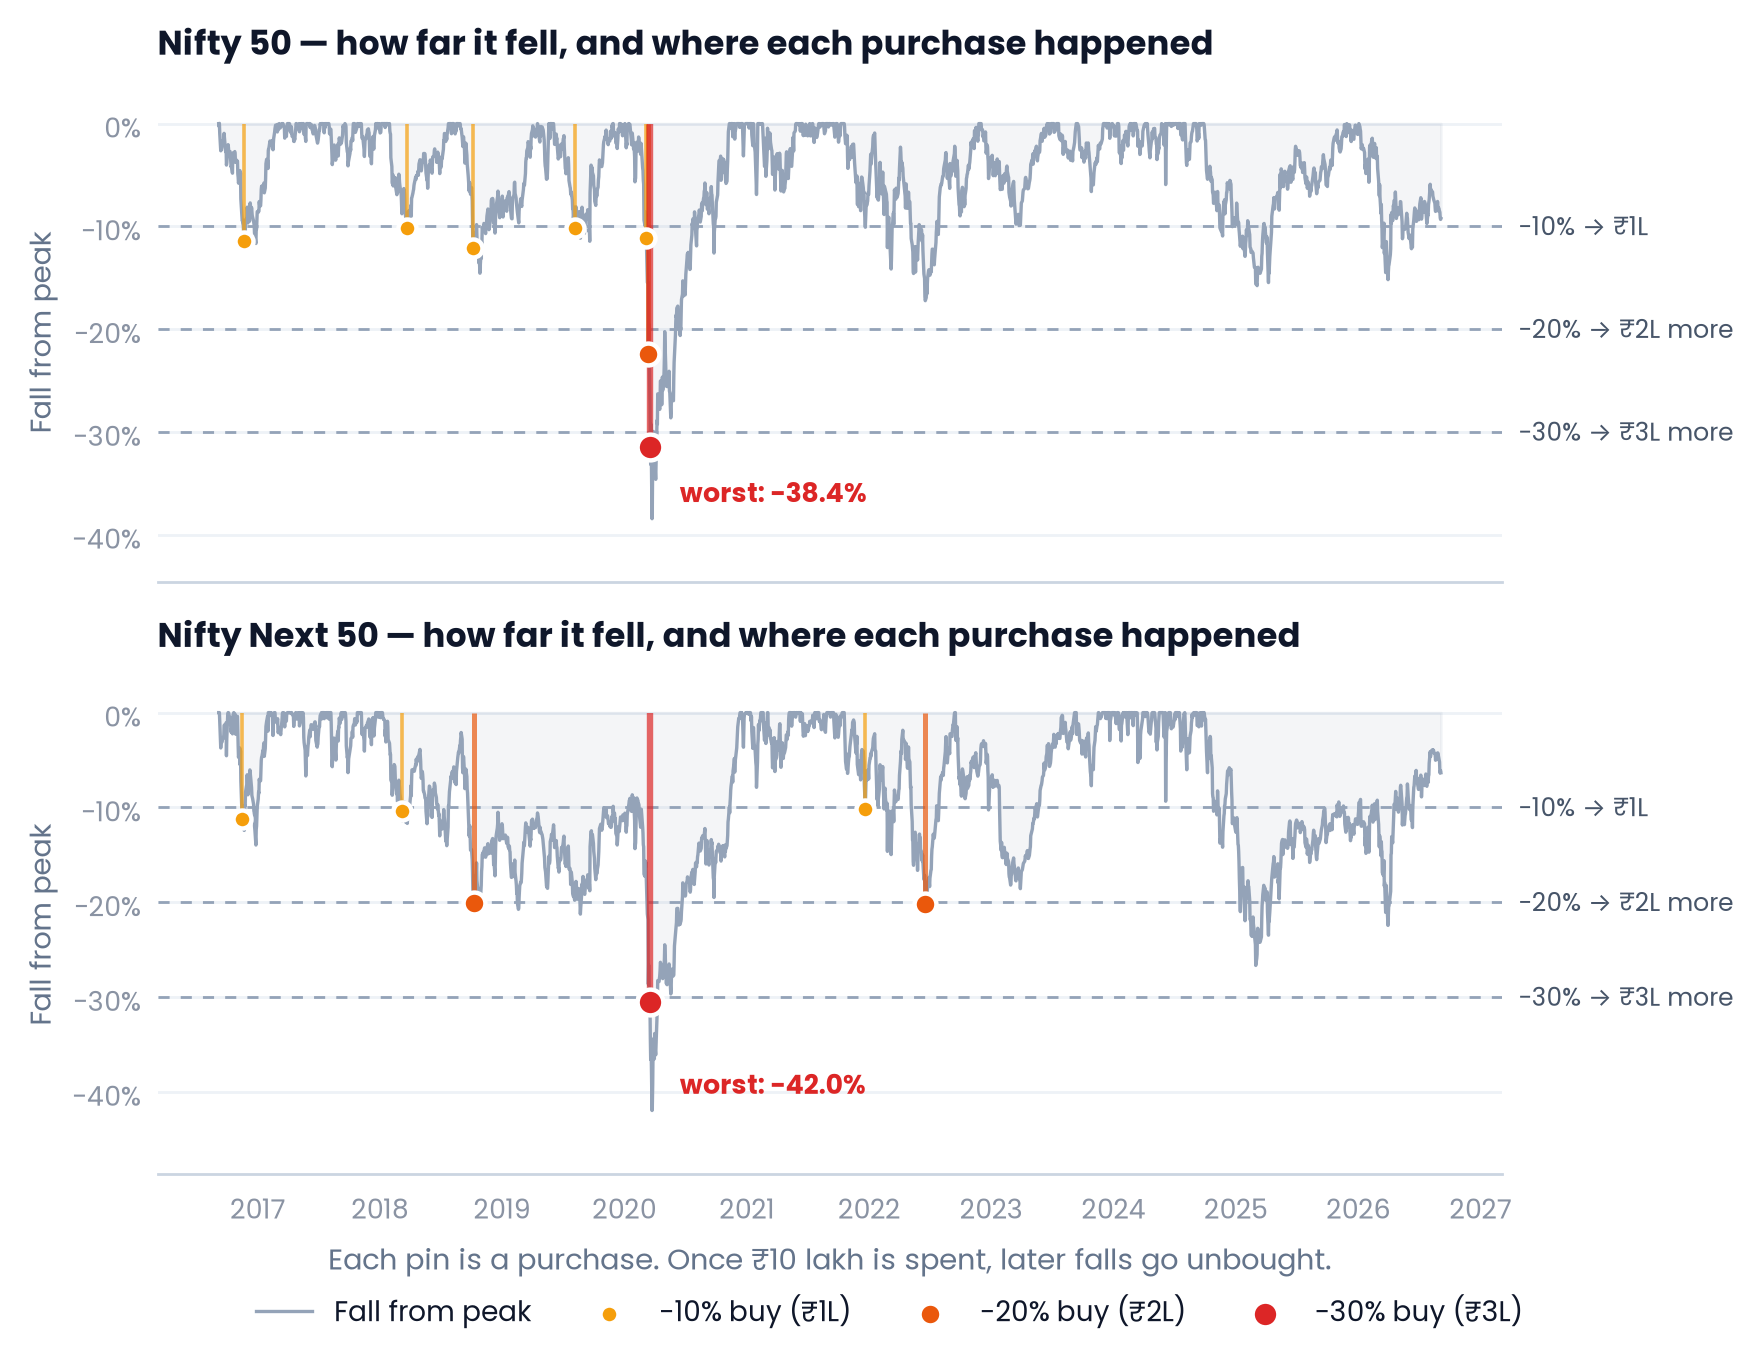
Seven purchases fired on the Nifty 50 and six on the Nifty Next 50. Both spent the full ₹10 lakh.
Nifty 50 — every purchase
| Date | Trigger | Fall from peak | Index close | Amount | Cumulative |
|---|---|---|---|---|---|
| 21 Nov 2016 | −10% | −11.43% | 7,929.10 | ₹1,00,000 | ₹1,00,000 |
| 23 Mar 2018 | −10% | −10.17% | 9,998.05 | ₹1,00,000 | ₹2,00,000 |
| 5 Oct 2018 | −10% | −12.11% | 10,316.45 | ₹1,00,000 | ₹3,00,000 |
| 5 Aug 2019 | −10% | −10.14% | 10,862.60 | ₹1,00,000 | ₹4,00,000 |
| 6 Mar 2020 | −10% | −11.11% | 10,989.45 | ₹1,00,000 | ₹5,00,000 |
| 12 Mar 2020 | −20% | −22.42% | 9,590.15 | ₹2,00,000 | ₹7,00,000 |
| 18 Mar 2020 | −30% | −31.50% | 8,468.79 | ₹3,00,000 | ₹10,00,000 |
Nifty Next 50 — every purchase
| Date | Trigger | Fall from peak | Index close | Amount | Cumulative |
|---|---|---|---|---|---|
| 15 Nov 2016 | −10% | −11.27% | 21,066.65 | ₹1,00,000 | ₹1,00,000 |
| 6 Mar 2018 | −10% | −10.33% | 28,623.30 | ₹1,00,000 | ₹2,00,000 |
| 9 Oct 2018 | −20% | −20.11% | 25,499.95 | ₹2,00,000 | ₹4,00,000 |
| 16 Mar 2020 | −30% | −30.50% | 22,184.35 | ₹3,00,000 | ₹7,00,000 |
| 20 Dec 2021 | −10% | −10.12% | 40,183.85 | ₹1,00,000 | ₹8,00,000 |
| 17 Jun 2022 | −20% | −20.22% | 35,668.20 | ₹2,00,000 | ₹10,00,000 |
The Nifty 50 log has a long build-up and then one decisive fortnight. Four ₹1 lakh buys landed between 2016 and 2019 as the index dipped 10% and recovered, and then the whole remaining ₹6 lakh went in over eight trading sessions in March 2020 — ₹1 lakh on the 6th at 11% down, ₹2 lakh on the 12th at 22% down, and ₹3 lakh on the 18th at 31% down. From that day the money was gone. Every fall since, including the drop to 15.2% below peak in March 2026, went unbought.
The Nifty Next 50 shows why the third buy matters so much. Its 10% and 20% buys were used up in March and October 2018, and since they only become available again at a new all-time high — which that index did not reach between January 2018 and December 2020 — both were still unavailable when COVID arrived. The 30% buy had never been used, so it was the only one left, and it put ₹3 lakh in on 16 March 2020 at 22,184. Without that third step the plan would have sat out a 42% crash completely.
Final value
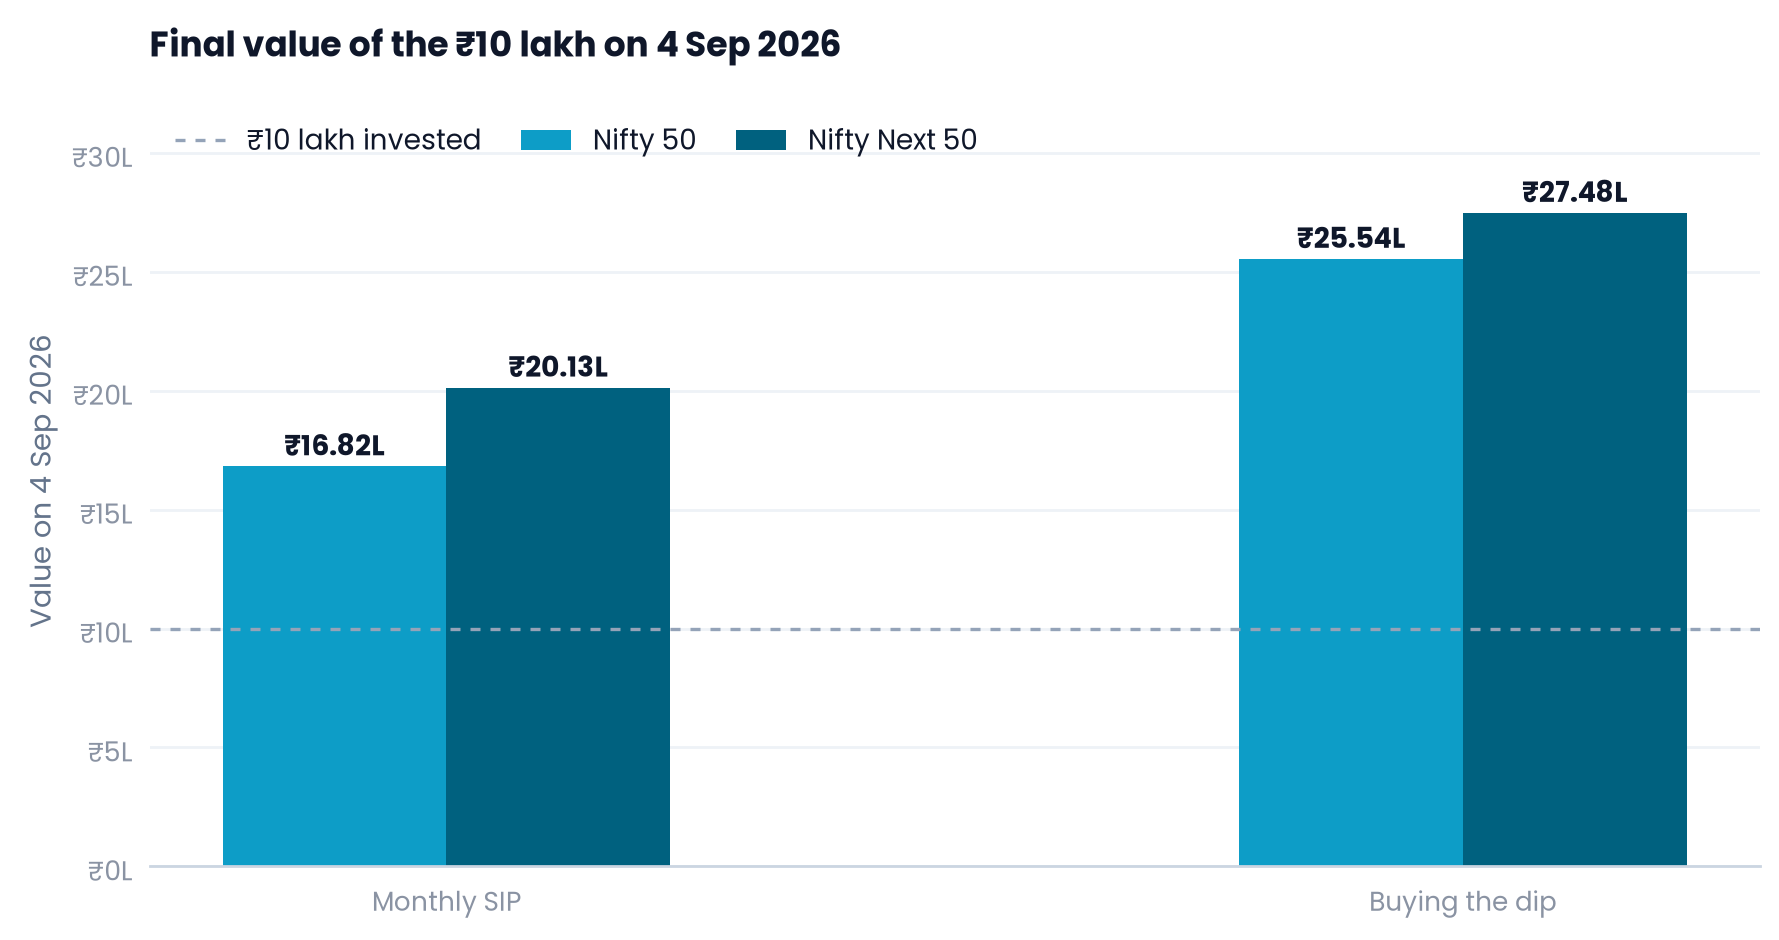
The reason for the gap is the price paid. On the Nifty 50 the dip plan bought its units at an average index level of 9,355 against the SIP's 14,208 — 34.2% cheaper. On the Nifty Next 50 it paid 26,523 against 36,202, 26.7% cheaper. Most of that edge comes from a handful of days in March 2020.
Nifty 50 vs Nifty Next 50
| Measure | Nifty 50 | Nifty Next 50 |
|---|---|---|
| Index on 6 Sep 2016 | 8,943.00 | 23,405.35 |
| Index on 4 Sep 2026 | 23,897.70 | 72,876.80 |
| Index CAGR | 10.33% | 12.03% |
| Worst fall from peak | −38.44% | −41.96% |
| SIP final value | ₹16,82,016 | ₹20,13,008 |
| SIP total gain | +68.20% | +101.30% |
| Dip final value | ₹25,54,459 | ₹27,47,637 |
| Dip total gain | +155.45% | +174.76% |
| Purchases made | 7 | 6 |
| Budget fully spent by | 18 Mar 2020 | 17 Jun 2022 |
| SIP average cost per unit | ₹14,207.54 | ₹36,202.21 |
| Dip average cost per unit | ₹9,355.29 | ₹26,523.44 |
The Nifty Next 50 beat the Nifty 50 on both strategies over this decade, and it did so while falling further. Its SIP gained 101.30% against 68.20% for the same SIP in the Nifty 50, on an index whose worst fall was 3.5 points deeper.
What the numbers show
Over these ten years, buying the dip beat the monthly SIP on both indices, because it bought its units 34.2% and 26.7% cheaper.
Two things made that happen, and both are worth knowing before copying it. Most of the edge came from a few days in March 2020: take the 30% buy away and the Nifty 50 plan finishes ₹3.7 lakh ahead of the SIP instead of ₹8.7 lakh, while on the Nifty Next 50 the lead shrinks from ₹7.3 lakh to ₹1.5 lakh. And the plan only works if the full ₹10 lakh sits available for years, waiting.
If your money arrives monthly from a salary, this is not a choice you have. You cannot buy a 30% crash with income you have not earned yet, so the SIP is the only one of these two you can actually run.
What this analysis does not say
These are index prices, so dividends of roughly 1% to 1.5% a year are left out, along with costs, taxes and tracking error. Two of those omissions pull in opposite directions rather than cancelling. Dividends favour the dip plan, which kept about 40% more rupee-years in the market, so counting them would widen the gap. Uninvested money earning nothing works the other way, because the SIP sits on the larger idle balance for longer — park it in a deposit and both results rise while the gap narrows. This is also one decade containing one exceptional crash, so a decade without a 30% fall would look very different.
Where to get this data yourself
Everything above comes from daily closing values of the two indices, which you can download free from the official sources:
- NSE Indices (the index provider) publishes historical index data at niftyindices.com/reports/historical-data. Choose the index and the date range, and it returns daily open, high, low, and close values as a CSV.
- NSE India hosts historical index reports at nseindia.com/reports-indices-historical-index-data.
Both give you the same closing values used here, so you can rebuild this test with your own SIP amount, your own trigger levels, or a different period.
References
- NSE Indices — Historical Index Data
- NSE India — Historical Index Data reports
- NSE Indices — Nifty 50 index factsheet
- NSE Indices — Nifty Next 50 index factsheet
- JPVFin — Nifty 50 vs Nifty Next 50: which index should you pick
All figures are computed from Nifty 50 and Nifty Next 50 daily closing values for 6 September 2016 to 4 September 2026, covering 2,479 trading sessions per index. Index charts are from TradingView. Returns are price returns and exclude dividends, costs, and taxes. Both strategies start with ₹10 lakh on day one and earn nothing on the part not yet invested, so total gain is measured on the same ₹10 lakh for both.
This analysis is for educational purposes only and does not constitute investment advice.
Related Articles


Stay ahead on finance & AI
Weekly articles on personal finance, investing strategies, and how AI is changing the way we manage money. Free. No spam.
Join free · Unsubscribe anytime · We never share your email.