S&P 500 Swing Trading Stocks to Watch in September 2026
Six S&P 500 stocks trading near key weekly support with rising volume: Netflix, Adobe, Devon, Copart, Tyler and GoDaddy. Charts, ratios and analyst targets.
We screened S&P 500 stocks on weekly charts and shortlisted six that are trading near key support levels with rising buying volume.
Each stock below includes its weekly candlestick chart, valuation, profitability and liquidity ratios, and the current analyst consensus. The companies are listed in decreasing order of market capitalization.
Where the data comes from. Price action, EMA and RSI readings are taken from the weekly charts shown in each section. Financial ratios are calculated from the companies' reported filings. Analyst ratings and price targets are from S&P Global Market Intelligence, which polls sell-side analysts at Wall Street brokerages and investment banks. All figures are as of August 29, 2026.
If you are new to financial ratios, our fundamental analysis series explains each ratio used below. You can also read the August 2026 edition of this watchlist.
1. Netflix, Inc. (NFLX) — Media and Streaming
Market capitalization: $340.28 billion
Netflix is a leading media company that operates an over-the-top (OTT) streaming platform.
Why is the stock down? The stock rose from a low of $20 in July 2022 to around $135 by June 2025, a threefold move in three years. It has since fallen from $130 to $70 over the past year. The decline reflects concerns about growth saturation, competition from YouTube, and a shift in viewing habits toward creator-led platforms built around shorter content. However, the company earns high operating margins and is able to pass rising costs on to subscribers.
Fundamental ratios
Valuation
| P/E (TTM) | Forward P/E | P/B | P/S | EV/EBITDA | PEG | EPS (TTM) |
|---|---|---|---|---|---|---|
| 25.75 | 23.58 | 11.29 | 7.03 | 23.62 | 1.11 | $3.17 |
Profitability
| ROE | ROA | ROIC | Gross Margin | Operating Margin | Net Margin |
|---|---|---|---|---|---|
| 49.54% | 16.09% | 32.43% | 49.12% | 29.68% | 28.22% |
Liquidity and financial health
| Current Ratio | Quick Ratio | Debt/Equity |
|---|---|---|
| 1.14 | 0.92 | 0.55 |
Weekly chart
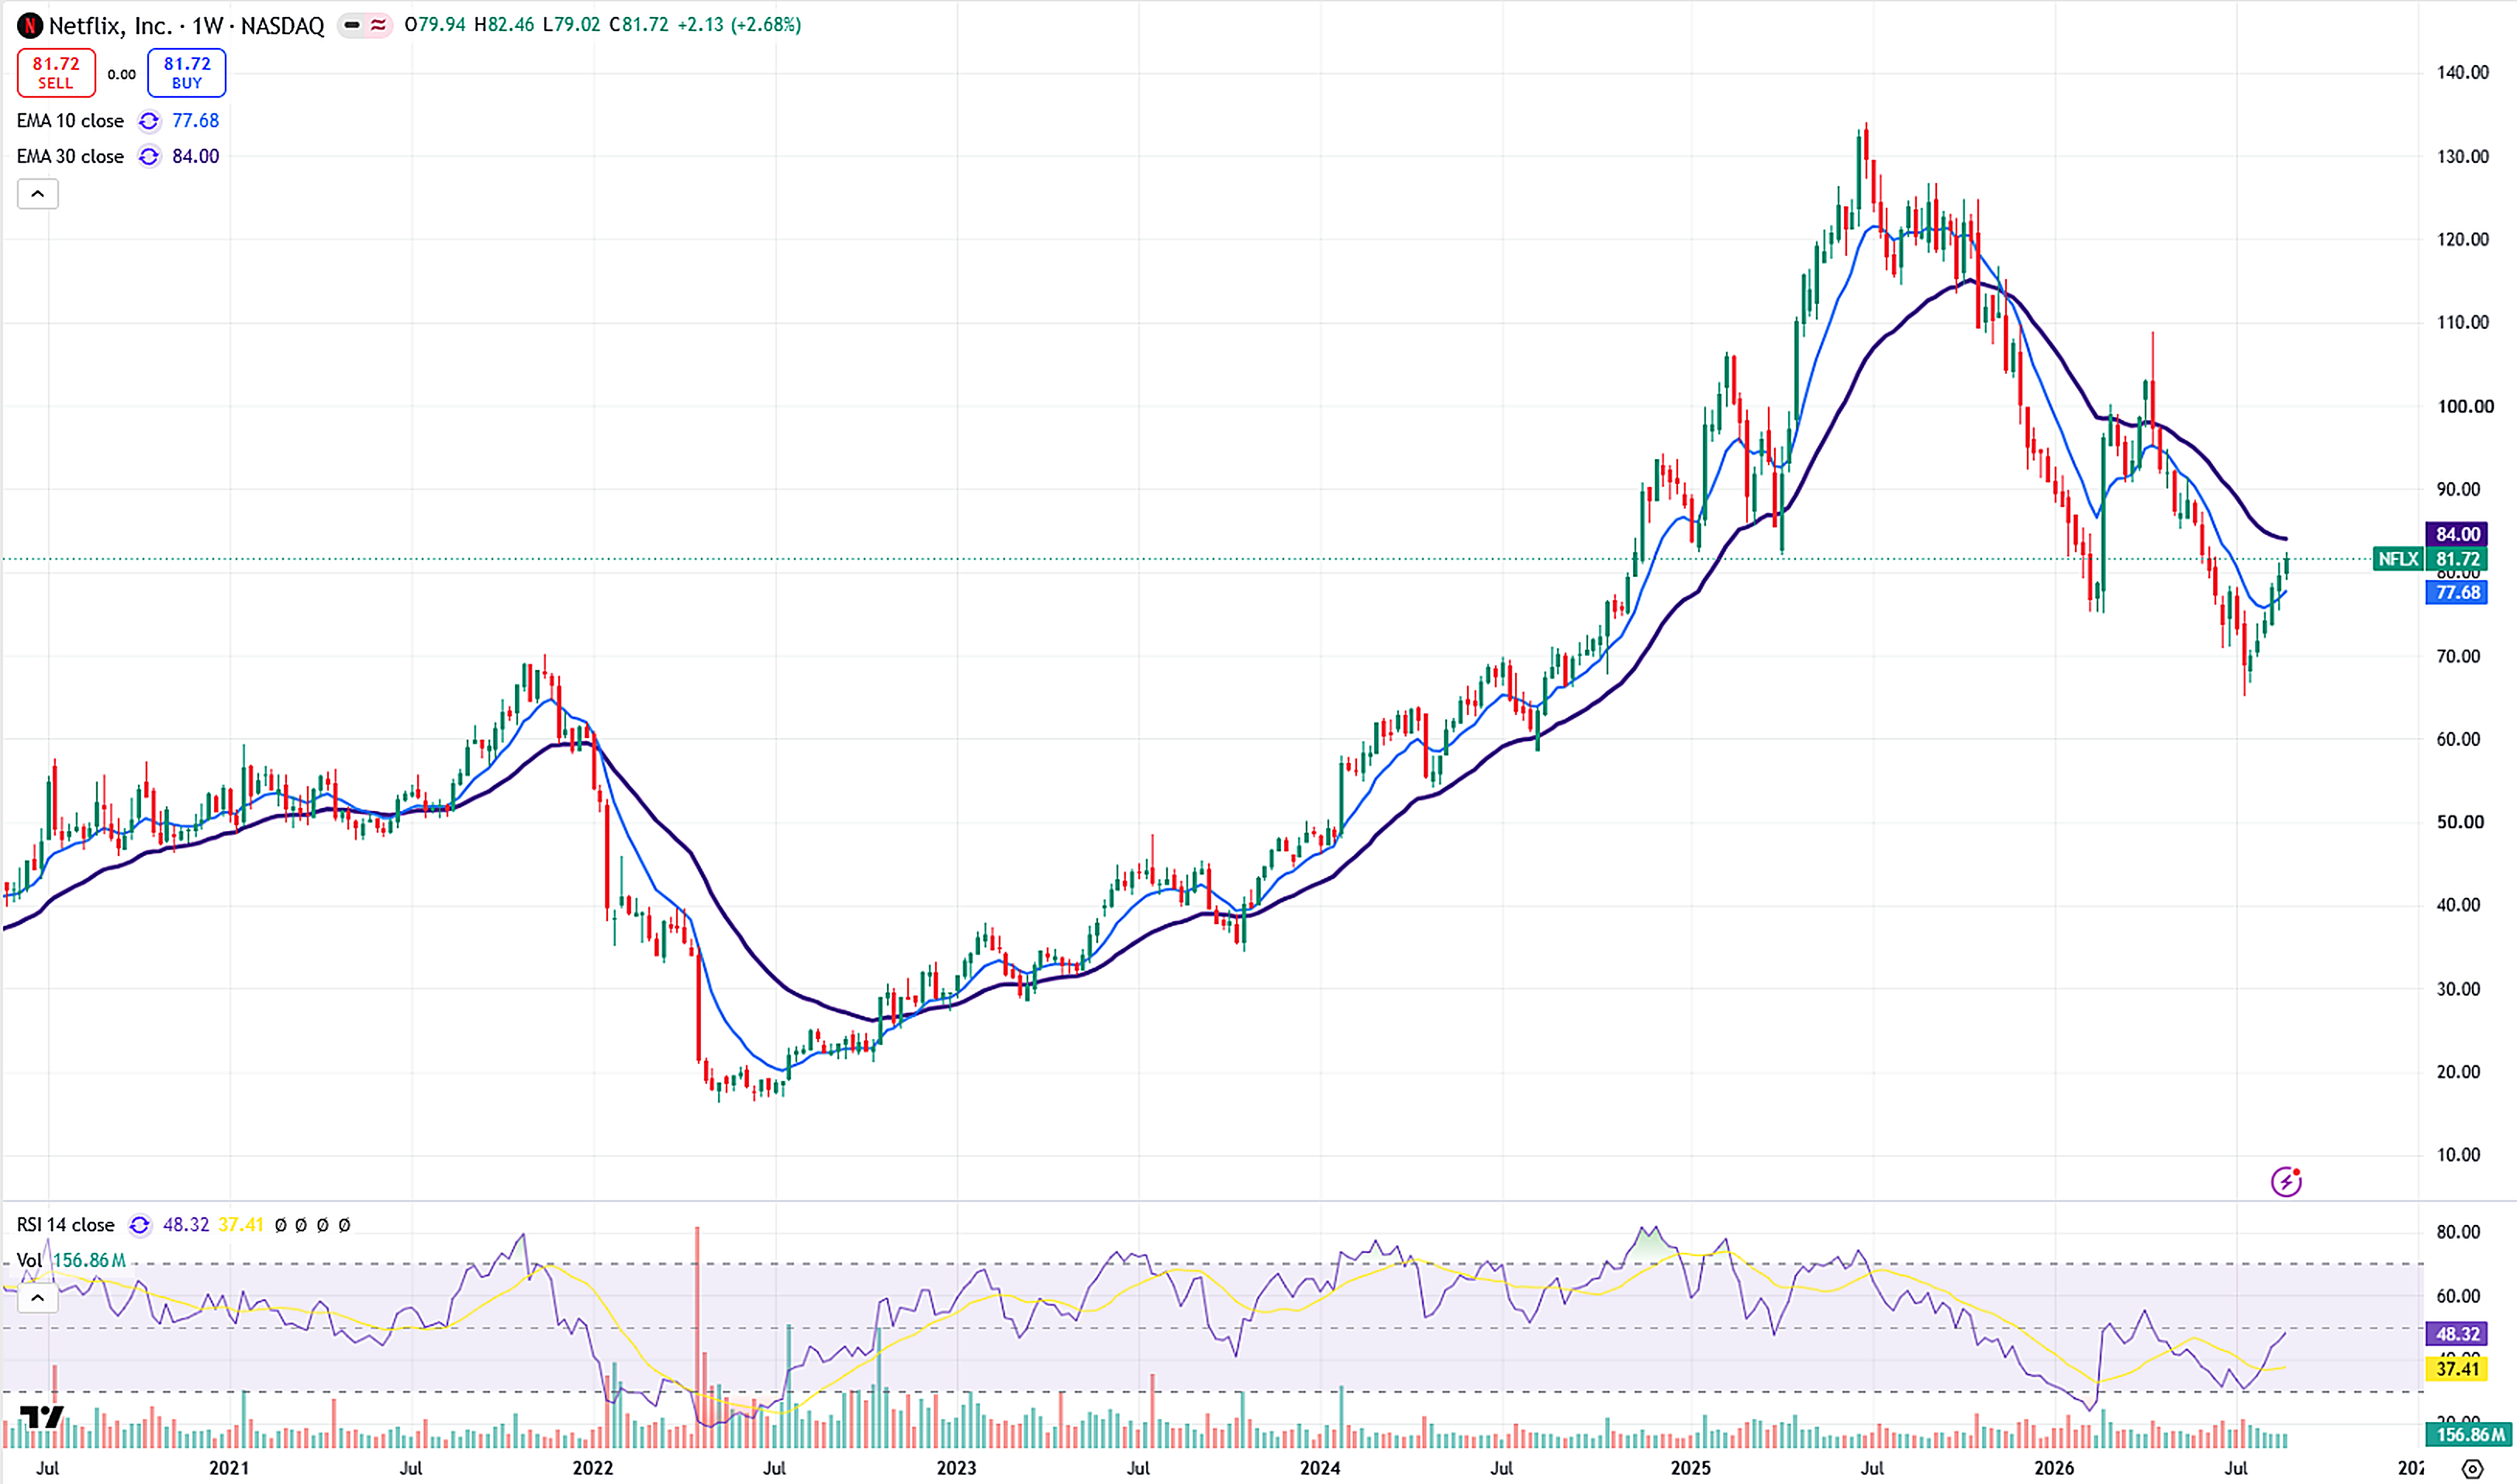
The weekly RSI stands at 48.32. The stock has found support at $70, a level that acted as resistance back in 2021. It is still forming lower lows, but $70 has held as an important support level.
Analyst consensus
Of the 51 analysts who have rated Netflix over the past three months, 28 rate it Strong Buy and 7 rate it Buy, while 16 rate it Hold. None rate it Sell. The consensus rating is Buy, with an average price target of $93.66, which implies about 14.6% upside. Individual targets range from $70 to $135, so the most bullish target on the street implies roughly 65% upside.
2. Adobe Inc. (ADBE) — Software
Market capitalization: $115.88 billion
Adobe is a US software company focused on digital media creation and editing. Its products include Photoshop and Lightroom, and it delivers a broad set of tools through Adobe Creative Cloud.
Why is the stock down? The stock has fallen more than 70% from its 2021 high. The main reason is the rise of generative AI tools that can handle digital media tasks without enterprise software. Adobe also faces competition from Canva, which is widely used for social media content creation. However, Adobe is addressing both pressures directly, and large enterprises are likely to remain cautious about open-source generative tools because of copyright exposure.
Fundamental ratios
Valuation
| P/E (TTM) | Forward P/E | P/B | P/S | EV/EBITDA | PEG | EPS (TTM) |
|---|---|---|---|---|---|---|
| 16.67 | 11.24 | 10.10 | 4.60 | 12.06 | 0.80 | $17.48 |
Profitability
| ROE | ROA | ROIC | Gross Margin | Operating Margin | Net Margin |
|---|---|---|---|---|---|
| 62.95% | 19.93% | 60.74% | 89.40% | 36.72% | 28.69% |
Liquidity and financial health
| Current Ratio | Quick Ratio | Debt/Equity |
|---|---|---|
| 0.75 | 0.63 | 0.61 |
Weekly chart
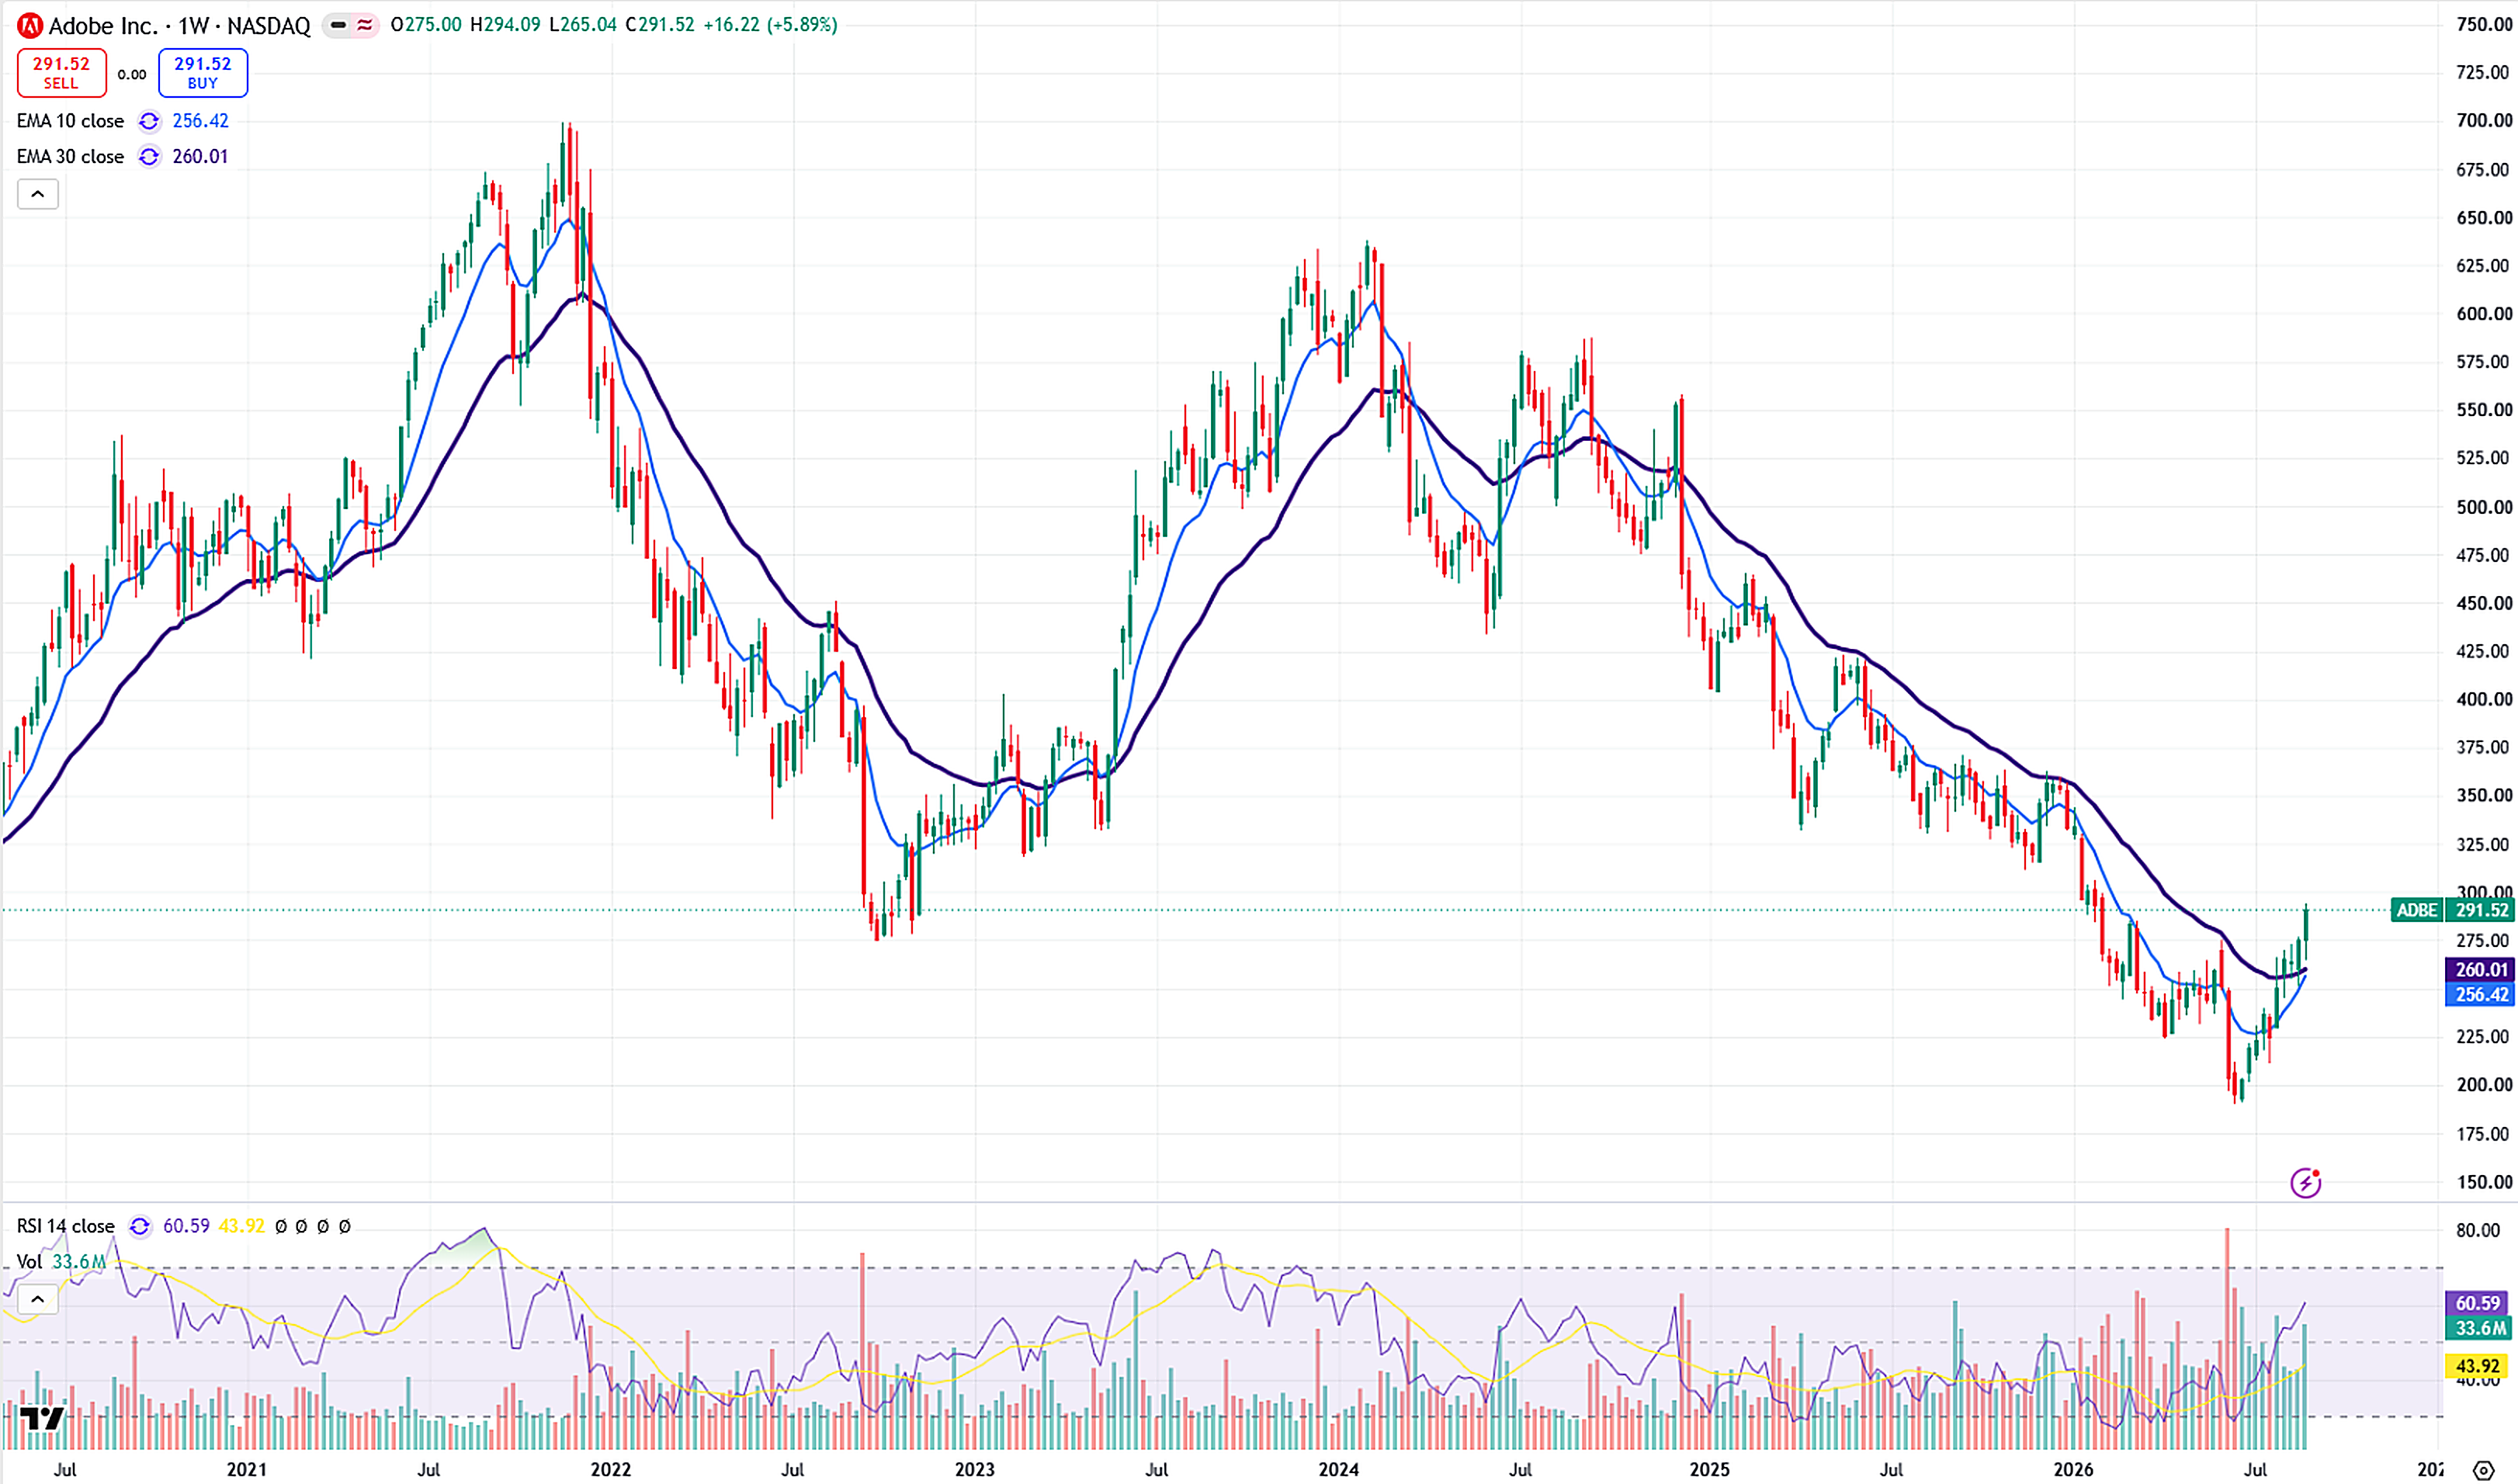
The stock established major support at $200 in June 2026 and has recovered to around $291 in just two months. Buying volume on the weekly chart has increased steadily, and the stock is trading above both its 10-week and 30-week EMAs. The weekly RSI is 60.59.
Analyst consensus
Of the 40 analysts who have rated Adobe over the past three months, 8 rate it Strong Buy and 4 rate it Buy, while 23 rate it Hold, 1 rates it Sell and 4 rate it Strong Sell. The consensus rating is Hold, with an average price target of $270.61, which sits about 7.2% below the current price. Individual targets range from $190 to $380. The recent rally has carried the stock past the average target, so the consensus has not yet caught up with the move.
3. Devon Energy Corporation (DVN) — Oil and Gas
Market capitalization: $54.45 billion
Devon Energy is an upstream oil and gas exploration and production company. Its share price is closely tied to commodity prices, particularly crude oil. We also covered this stock in the August 2026 edition of this watchlist.
Fundamental ratios
Valuation
| P/E (TTM) | Forward P/E | P/B | P/S | EV/EBITDA | PEG | EPS (TTM) |
|---|---|---|---|---|---|---|
| 10.15 | 9.12 | 1.30 | 2.90 | 7.33 | 1.01 | $4.66 |
Profitability
| ROE | ROA | ROIC | Gross Margin | Operating Margin | Net Margin |
|---|---|---|---|---|---|
| 11.52% | 5.91% | 10.06% | 50.35% | 25.74% | 17.46% |
Liquidity and financial health
| Current Ratio | Quick Ratio | Debt/Equity |
|---|---|---|
| 0.72 | 0.58 | 0.28 |
For the trailing twelve months ended June 30, 2026, Devon reported revenue of $18.78 billion and net income of $3.28 billion.
Weekly chart
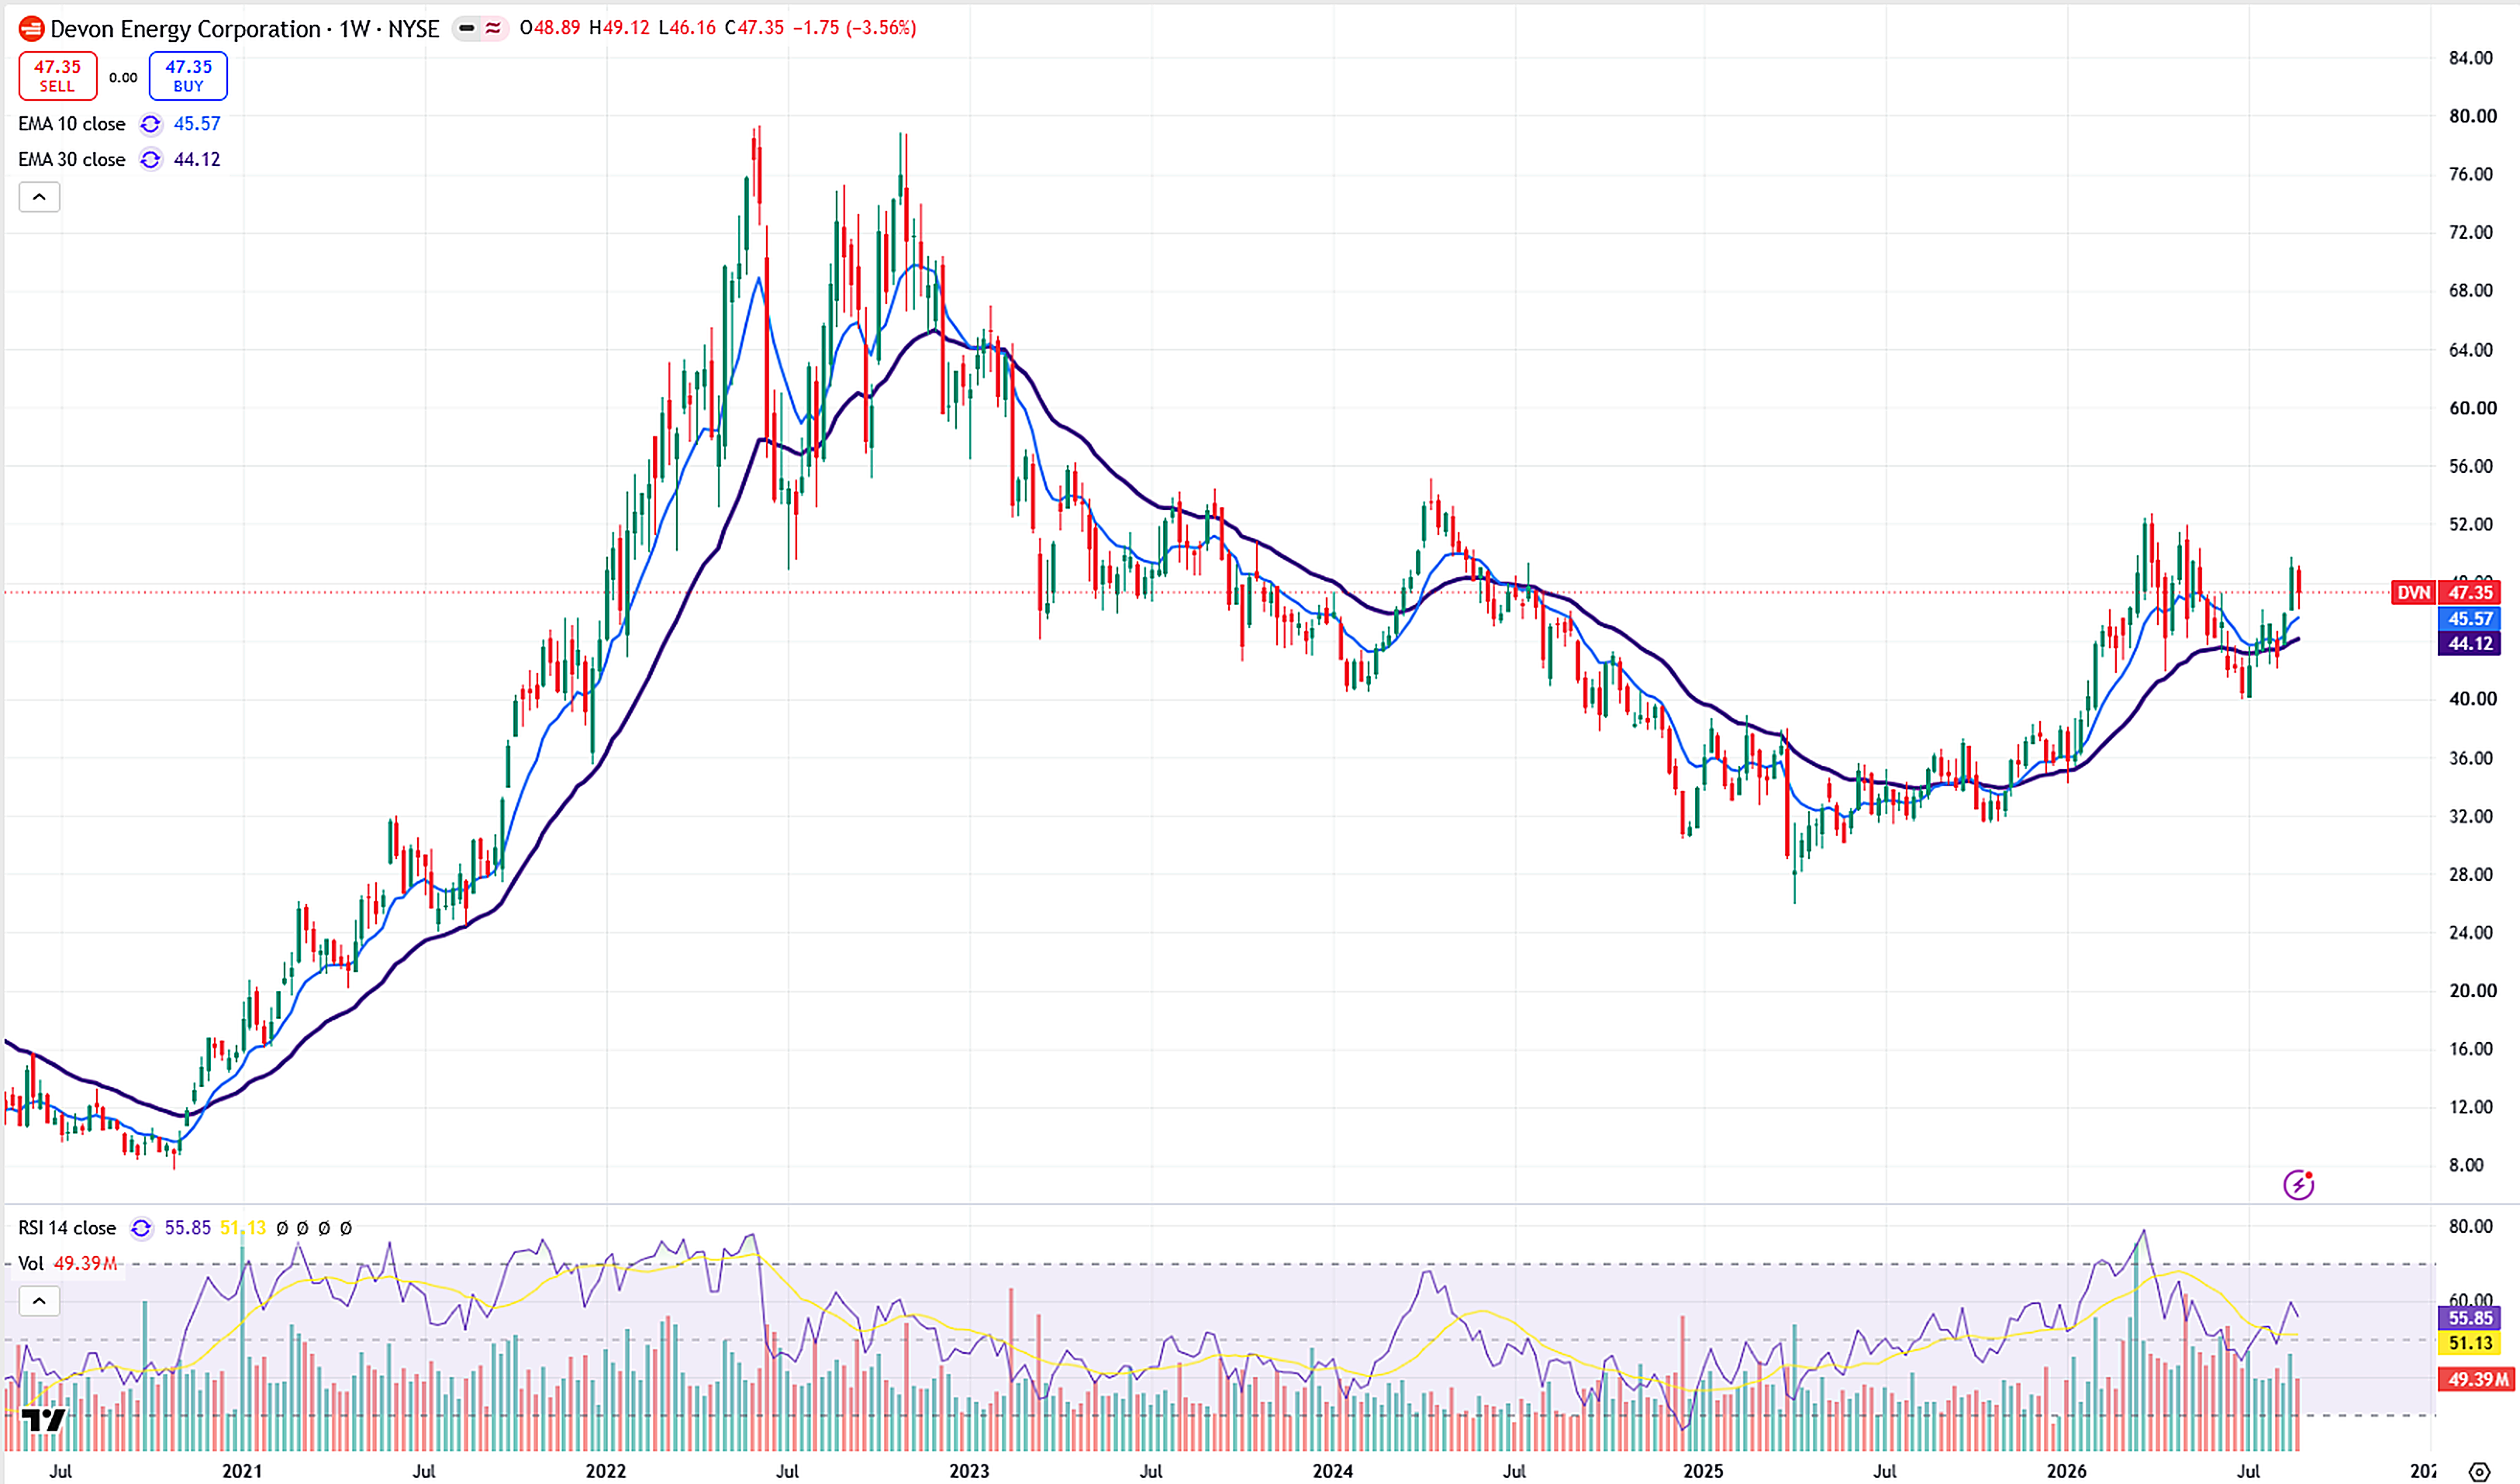
The stock is trading above both its 10-week and 30-week EMAs and is forming a cup and handle pattern. A sustained move above the $45 to $50 zone would complete the pattern. The weekly RSI is 55.85.
Analyst consensus
Of the 27 analysts who have rated Devon Energy over the past three months, 21 rate it Strong Buy and 3 rate it Buy, while 3 rate it Hold. None rate it Sell. The consensus rating is Strong Buy, with an average price target of $59.46, which implies about 25.6% upside. Individual targets range from $44 to $68.
4. Copart, Inc. (CPRT) — Vehicle Remarketing
Market capitalization: $30.54 billion
Copart operates a leading online marketplace for vehicle remarketing. It specializes in processing and auctioning salvage vehicles.
Why is the stock down? The stock fell more than 50% over the past year, found multi-year support around $28, and has rebounded to $33 in a single month. The decline was driven by softer demand for used cars and lower insurance unit volumes. However, the company carries almost no debt and earns net margins above 30%.
Fundamental ratios
Valuation
| P/E (TTM) | Forward P/E | P/B | P/S | EV/EBITDA | PEG | EPS (TTM) |
|---|---|---|---|---|---|---|
| 20.49 | 20.35 | 3.48 | 6.58 | 13.48 | 1.88 | $1.61 |
Profitability
| ROE | ROA | ROIC | Gross Margin | Operating Margin | Net Margin |
|---|---|---|---|---|---|
| 17.61% | 11.34% | 29.98% | 47.52% | 37.77% | 33.48% |
Liquidity and financial health
| Current Ratio | Quick Ratio | Debt/Equity |
|---|---|---|
| 7.61 | 7.29 | 0.01 |
A current ratio of 7.61 and a debt-to-equity ratio of 0.01 make this the strongest balance sheet among the six companies covered here.
Weekly chart
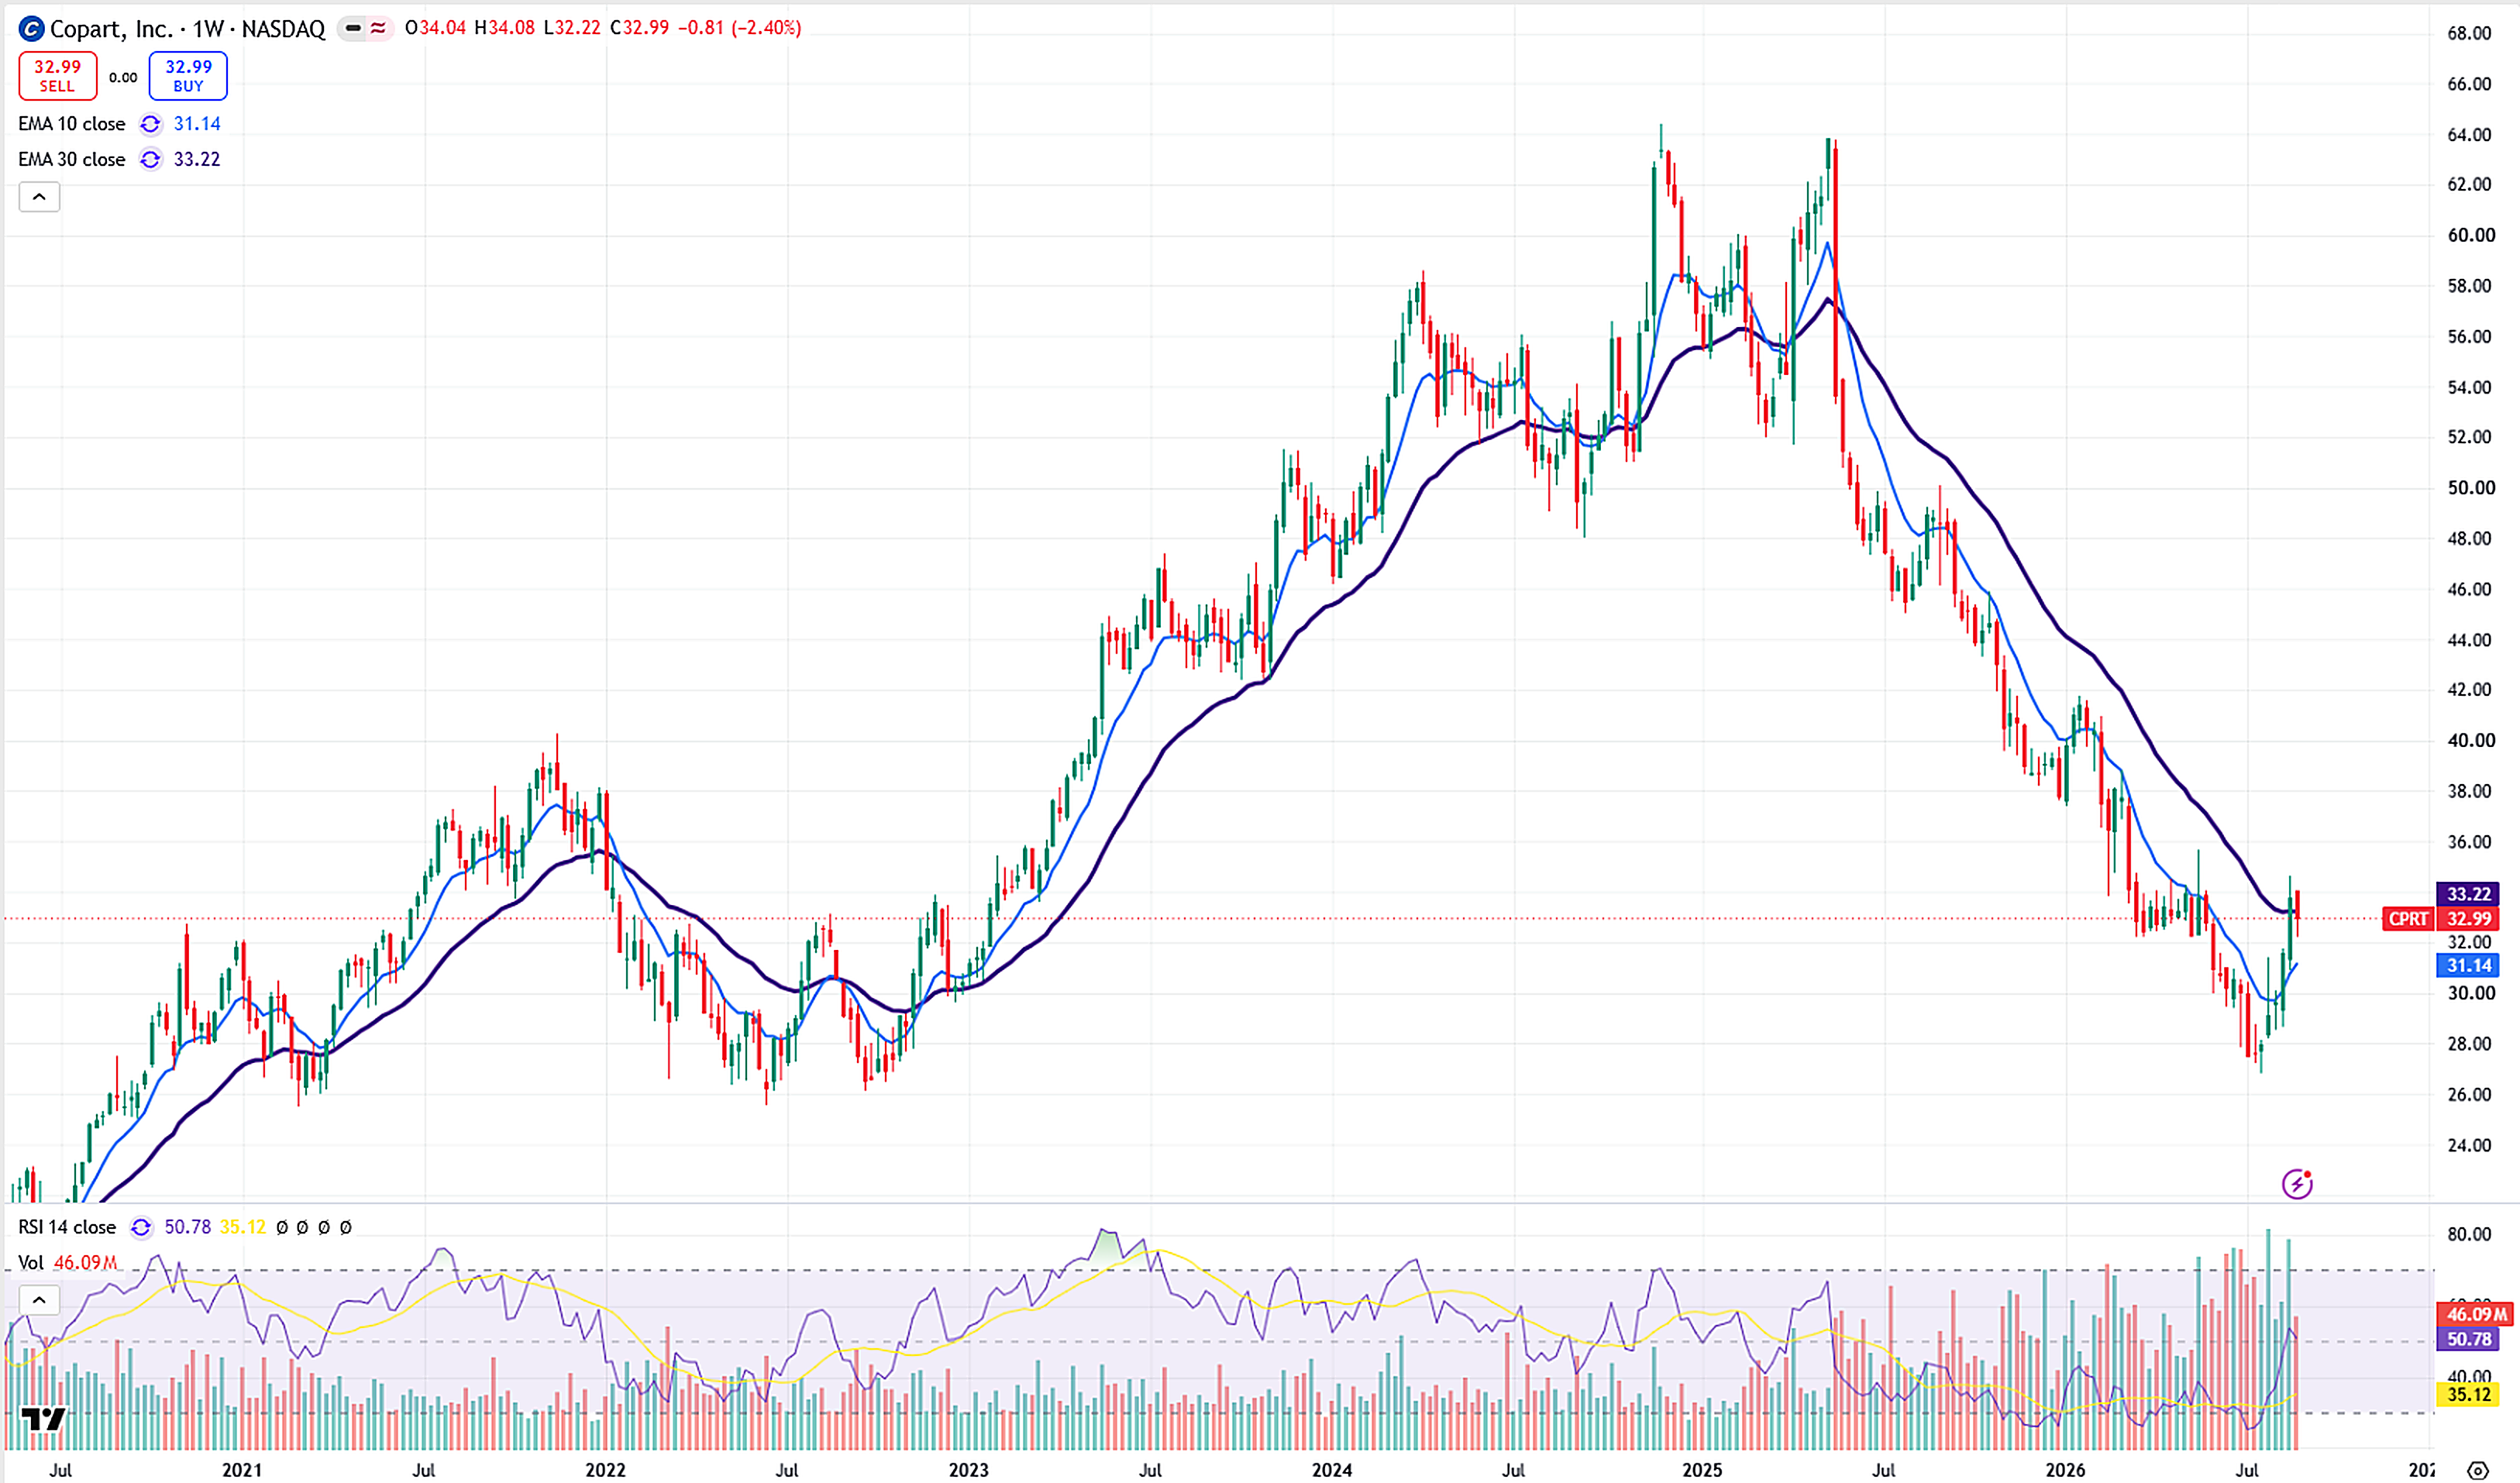
Weekly volume bars are rising and the stock is trading close to both its 10-week and 30-week EMAs. The weekly RSI is 50.78.
Analyst consensus
Of the 13 analysts who have rated Copart over the past three months, 4 rate it Strong Buy and 3 rate it Buy, while 5 rate it Hold and 1 rates it Sell. The consensus rating is Buy, with an average price target of $40.20, which implies about 21.9% upside. Individual targets range from $25 to $55.
5. Tyler Technologies, Inc. (TYL) — Government Software
Market capitalization: $15.48 billion
Tyler Technologies is one of the largest software companies in North America serving the government and public sector exclusively. Its main areas are enterprise resource planning, state and federal solutions, and courts and justice systems.
Why is the stock down? The stock is down more than 50% from its 2025 all-time high. The main concerns are generative AI based software solutions and the possibility that US government departments build such systems in-house. There is also a risk that generative AI compresses the company's margins. In response, Tyler has launched a government-grade secure AI framework, and management has raised its long-term targets.
Fundamental ratios
Valuation
| P/E (TTM) | Forward P/E | P/B | P/S | EV/EBITDA | PEG | EPS (TTM) |
|---|---|---|---|---|---|---|
| 49.77 | 26.34 | 5.09 | 6.37 | 34.81 | 1.70 | $7.59 |
Profitability
| ROE | ROA | ROIC | Gross Margin | Operating Margin | Net Margin |
|---|---|---|---|---|---|
| 9.73% | 4.18% | 8.57% | 47.21% | 15.46% | 13.36% |
Liquidity and financial health
| Current Ratio | Quick Ratio | Debt/Equity |
|---|---|---|
| 1.55 | 1.47 | 0.48 |
Note that Tyler trades at the highest valuation in this group, at 49.77 times trailing earnings. The forward P/E of 26.34 reflects the earnings growth analysts expect over the next twelve months.
Weekly chart
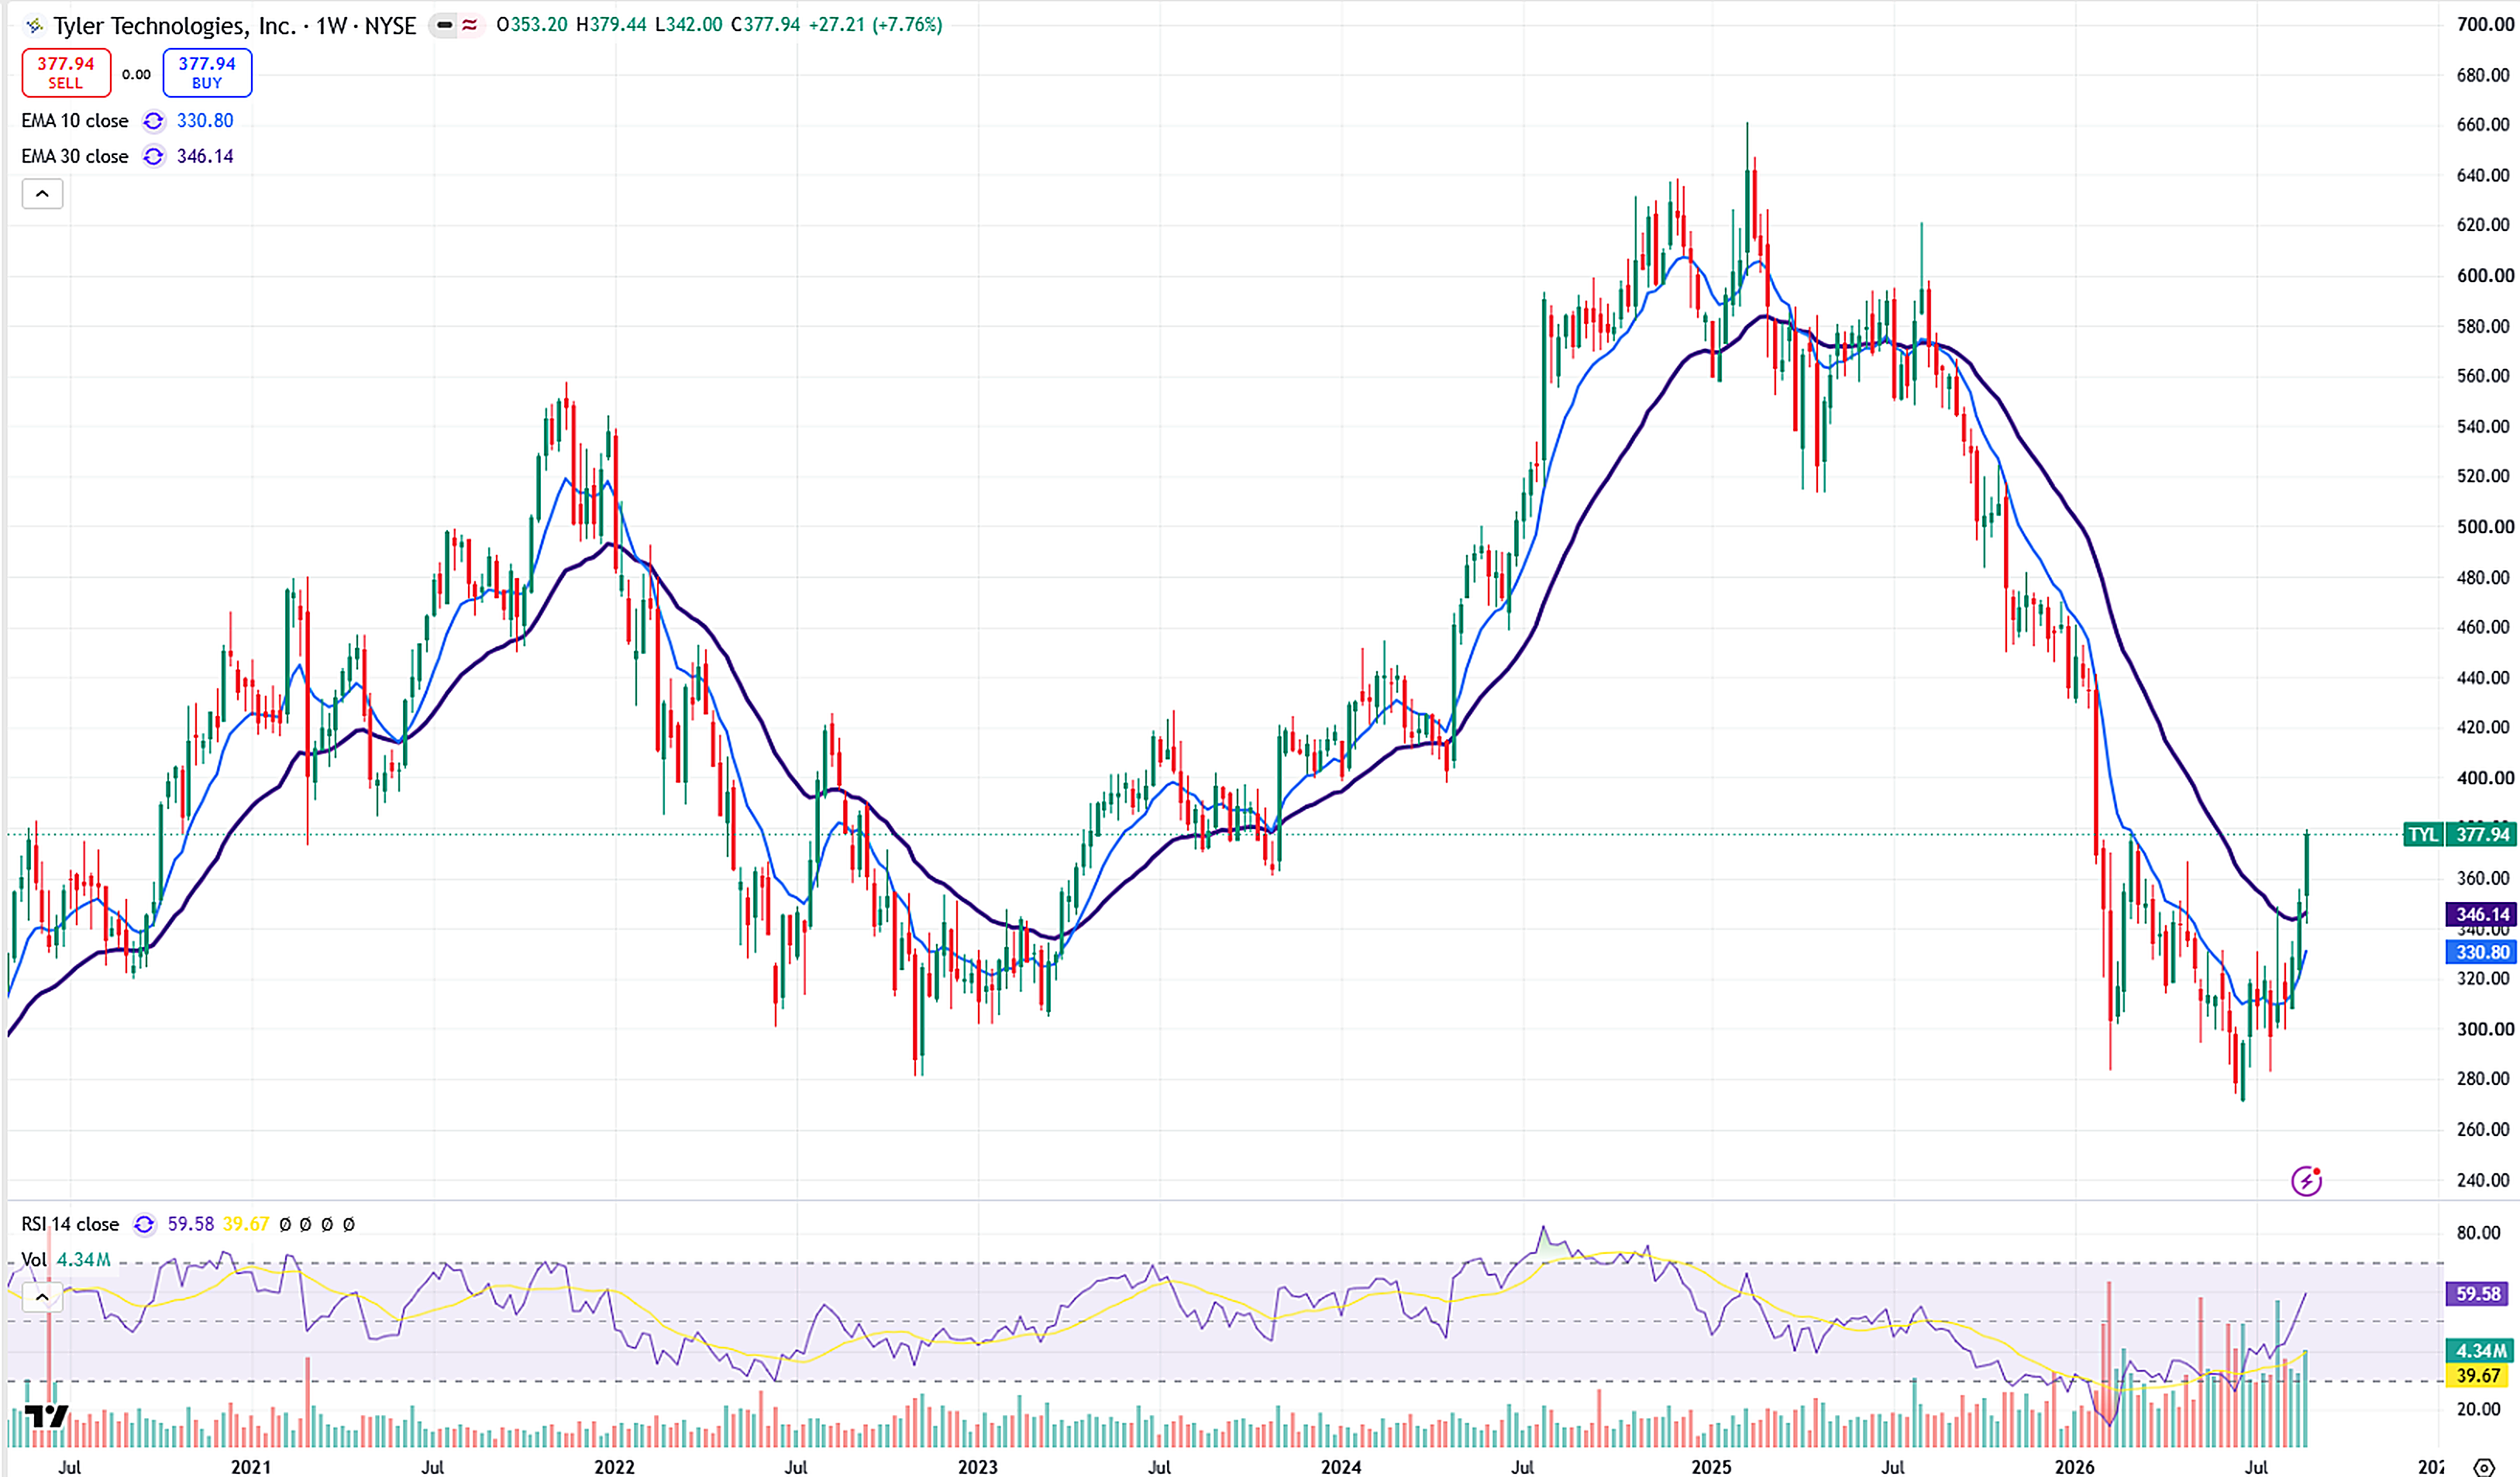
The stock found support around $280 and has rebounded to roughly $370 within a few months. Volume is increasing and the stock is trading above both its 10-week and 30-week EMAs. The weekly RSI is 59.58.
Analyst consensus
Of the 22 analysts who have rated Tyler Technologies over the past three months, 13 rate it Strong Buy and 6 rate it Buy, while 3 rate it Hold. None rate it Sell. The consensus rating is Buy, with an average price target of $426.64, which implies about 12.9% upside. Individual targets range from $335 to $525.
6. GoDaddy Inc. (GDDY) — Internet Services
Market capitalization: $12.37 billion
GoDaddy is the world's largest domain name registrar. It sells web addresses and hosting, and provides website building software along with online marketing and payment tools.
Why is the stock down? The stock has fallen more than 60% from its high. A key reason is that customers sign up for discounted first-year domain registrations but do not renew at the higher standard rates. GoDaddy also faces competition from automated website builders such as Wix, and AI-generated overviews in search results are reducing traffic to customer websites.
In response, GoDaddy is making its tools compatible with LLM-based search and exposing its APIs to those systems. It has built a proprietary AI visibility tool directly into its website builder, and it has anchored the business around Airo, its centralized AI platform that handles everything from logo generation to website creation, email, and social media marketing.
Fundamental ratios
Valuation
| P/E (TTM) | Forward P/E | P/S | EV/EBITDA | PEG | EPS (TTM) |
|---|---|---|---|---|---|
| 14.51 | 11.55 | 2.42 | 10.89 | 0.64 | $6.74 |
Profitability
| ROA | ROIC | Gross Margin | Operating Margin | Net Margin |
|---|---|---|---|---|
| 9.88% | 37.26% | 63.80% | 25.20% | 17.83% |
Liquidity and financial health
| Current Ratio | Quick Ratio |
|---|---|
| 0.63 | 0.42 |
Weekly chart
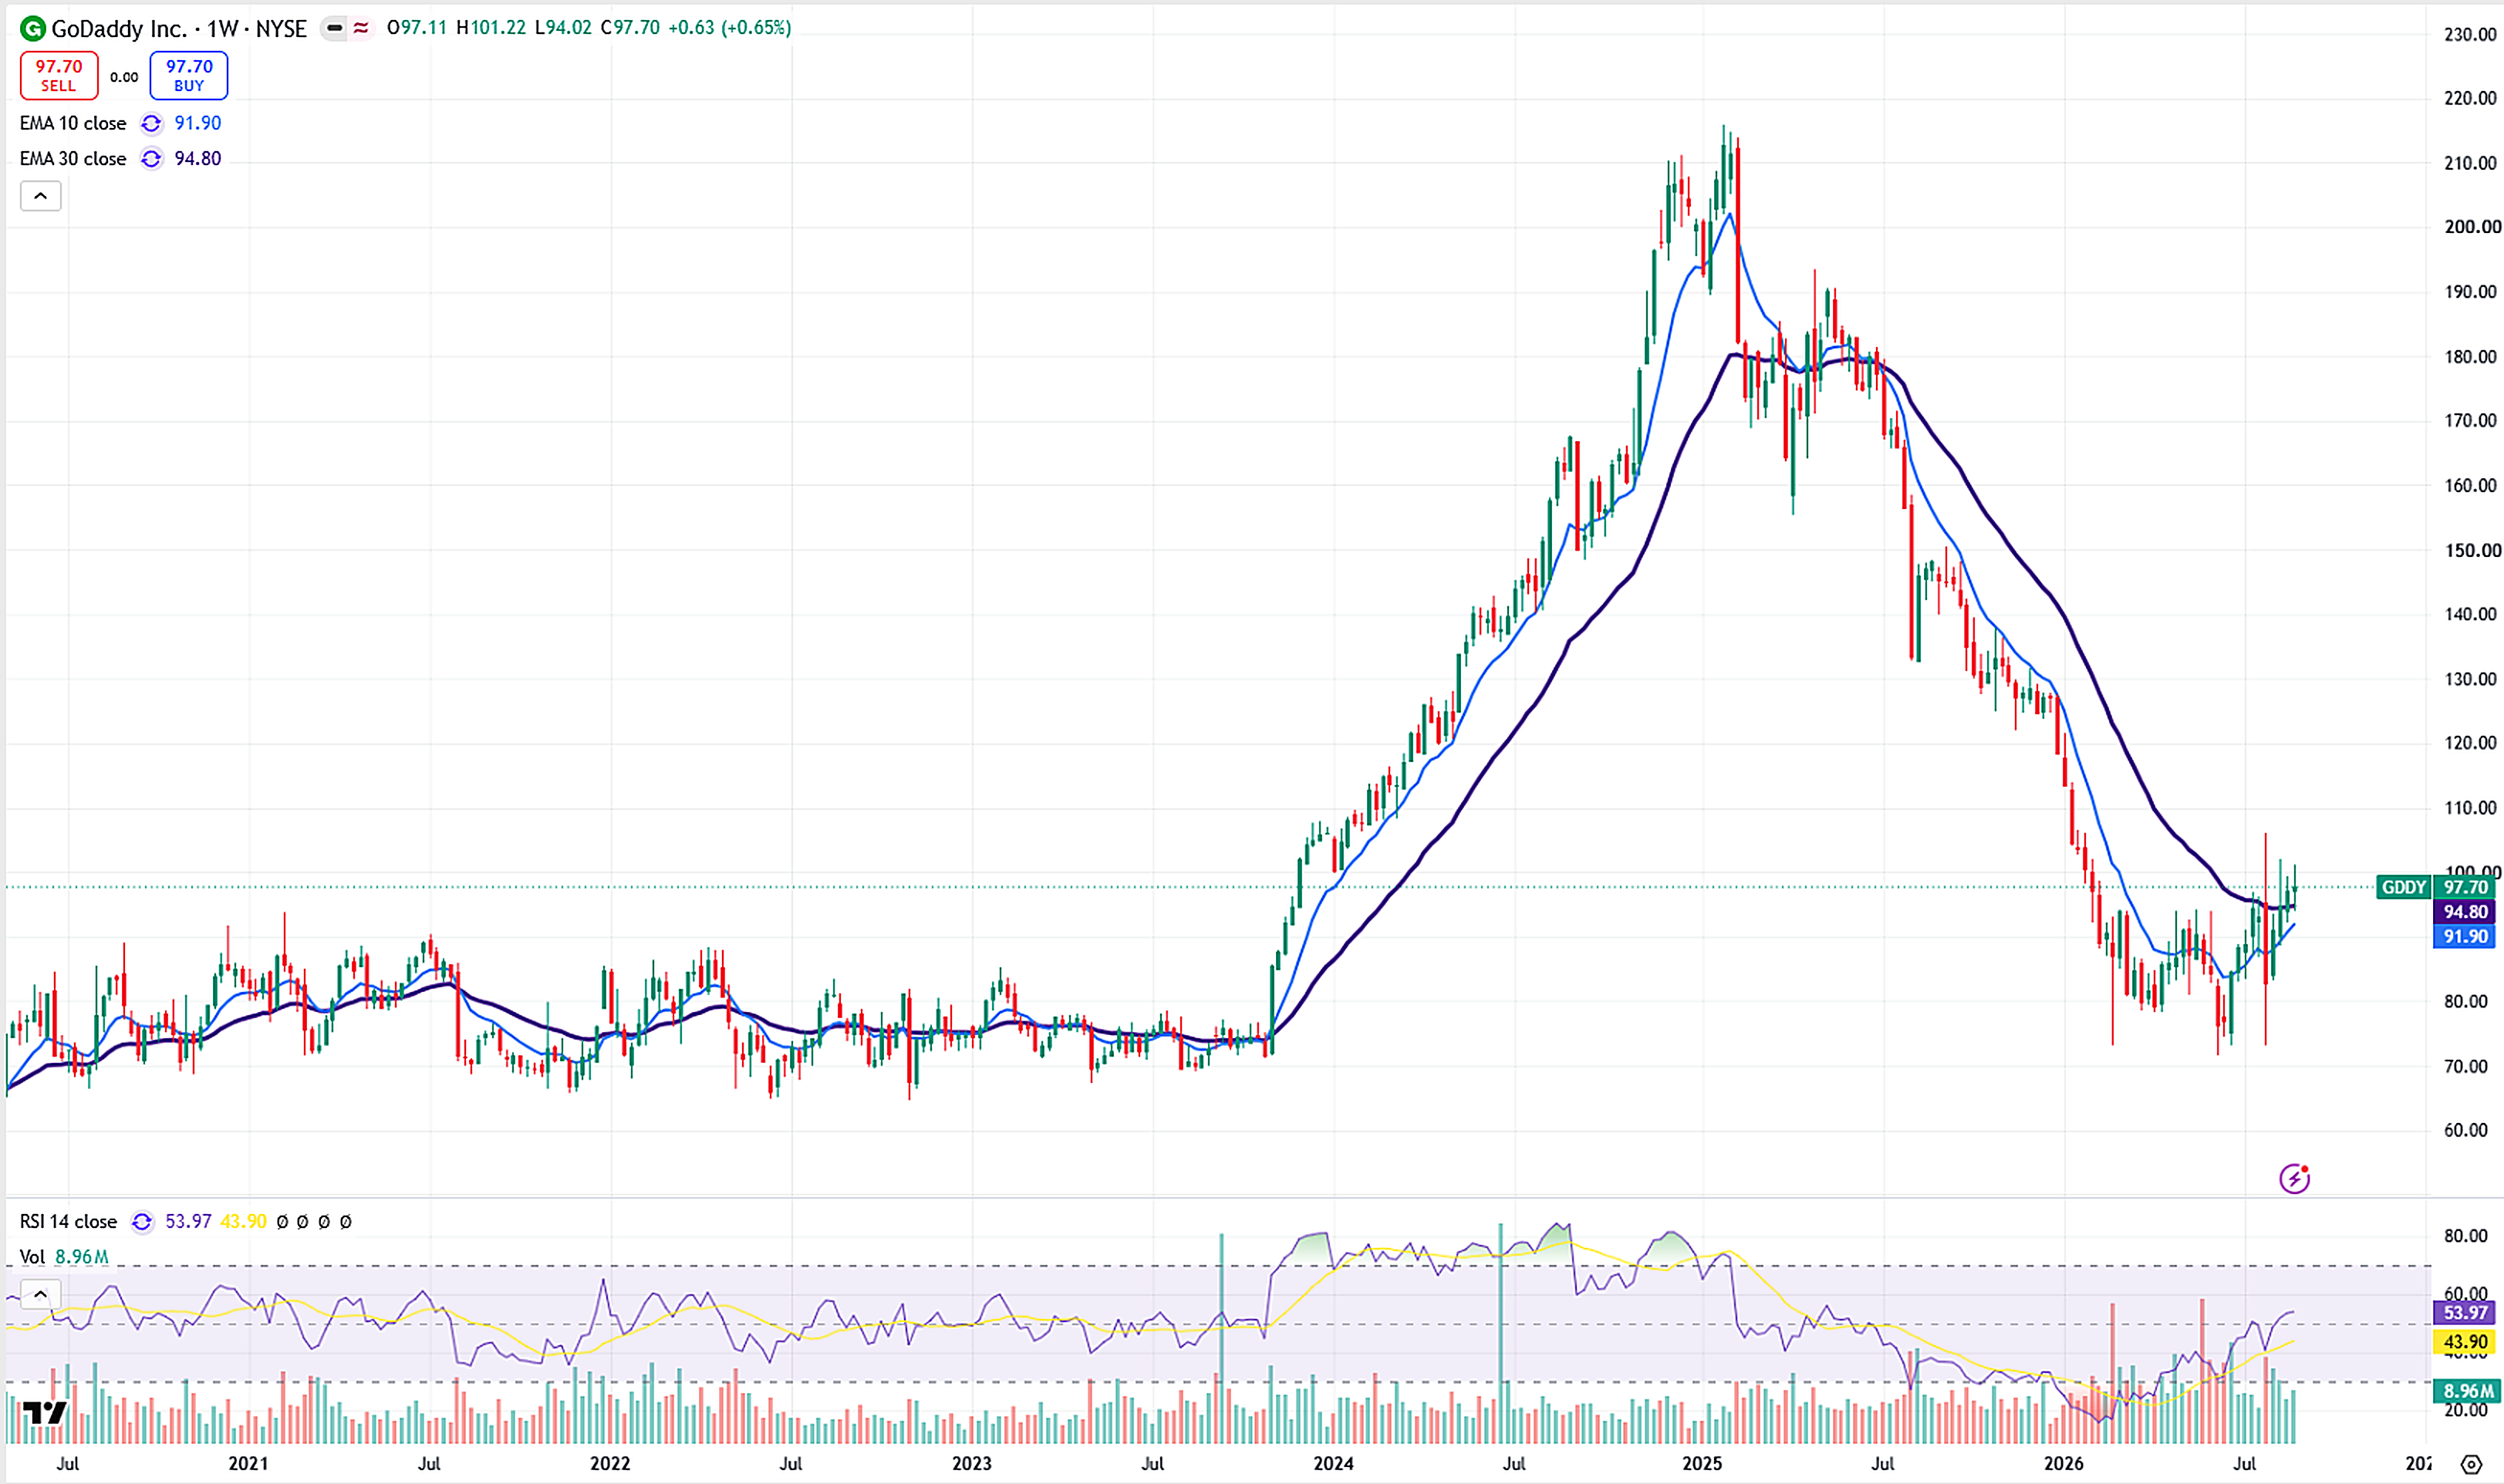
The stock found support around $75 and has traded in that zone for the past eight months. Buying volume is increasing and the stock is now trading above both its 10-week and 30-week EMAs. The weekly RSI is 53.97.
Analyst consensus
Of the 17 analysts who have rated GoDaddy over the past three months, 5 rate it Strong Buy and 3 rate it Buy, while 8 rate it Hold and 1 rates it Strong Sell. The consensus rating is Buy, with an average price target of $104.53, which implies about 7.0% upside. Individual targets range from $76 to $170.
Summary
The six companies are listed in decreasing order of market capitalization. All prices are as of August 29, 2026.
| Stock | Market Cap | Price | P/E | Net Margin | Weekly RSI |
|---|---|---|---|---|---|
| Netflix (NFLX) | $340.28B | $81.72 | 25.75 | 28.22% | 48.32 |
| Adobe (ADBE) | $115.88B | $291.52 | 16.67 | 28.69% | 60.59 |
| Devon Energy (DVN) | $54.45B | $47.35 | 10.15 | 17.46% | 55.85 |
| Copart (CPRT) | $30.54B | $32.99 | 20.49 | 33.48% | 50.78 |
| Tyler Technologies (TYL) | $15.48B | $377.94 | 49.77 | 13.36% | 59.58 |
| GoDaddy (GDDY) | $12.37B | $97.70 | 14.51 | 17.83% | 53.97 |
Analyst consensus at a glance
| Stock | Analysts | Consensus | Average Target | Implied Upside |
|---|---|---|---|---|
| Netflix (NFLX) | 51 | Buy | $93.66 | +14.6% |
| Adobe (ADBE) | 40 | Hold | $270.61 | -7.2% |
| Devon Energy (DVN) | 27 | Strong Buy | $59.46 | +25.6% |
| Copart (CPRT) | 13 | Buy | $40.20 | +21.9% |
| Tyler Technologies (TYL) | 22 | Buy | $426.64 | +12.9% |
| GoDaddy (GDDY) | 17 | Buy | $104.53 | +7.0% |
Analyst ratings and price targets are from S&P Global Market Intelligence and reflect the three months to August 2026.
Related guides
- Valuation Ratios Explained: P/E, P/B, EPS, PEG, and P/S
- Profitability Ratios Explained: ROE, ROA, ROCE, and Margins
- Liquidity Ratios Explained: Current Ratio, Quick Ratio, and Cash Ratio
- Solvency Ratios Explained: Debt-to-Equity, Debt Ratio, and More
Sources and references
Analyst ratings and price targets
- Consensus ratings, analyst counts and price targets are provided by S&P Global Market Intelligence, which aggregates ratings from sell-side analysts at Wall Street brokerages and investment banks over the three months to August 2026.
Financial statements and ratios
- SEC EDGAR — company filings (10-K and 10-Q)
- Netflix Investor Relations
- Adobe Investor Relations
- Devon Energy Investor Relations
- Copart Investor Relations
- Tyler Technologies Investor Relations
- GoDaddy Investor Relations
A note on consensus figures. Different data providers publish slightly different consensus numbers for the same stock, because they poll different analyst panels and use different time windows. The figures in this article come from a single provider so that all six companies are measured on a consistent basis. Always check current figures with your own broker before acting on them.
All data is as of August 29, 2026 and is subject to change with market conditions.
Disclaimer: This article is for educational and informational purposes only. It is not financial advice and should not be treated as a recommendation to buy or sell any stock. All investments carry risk, including the potential loss of principal. Always do your own research or consult a licensed financial advisor before making investment decisions. Past performance does not guarantee future results.
Related Articles


Stay ahead on finance & AI
Weekly articles on personal finance, investing strategies, and how AI is changing the way we manage money. Free. No spam.
Join free · Unsubscribe anytime · We never share your email.