S&P 500 Swing Trading Stocks to Watch in August 2026
We screened all S&P 500 stocks on weekly charts and found 6 swing trading setups with analyst upside targets up to 40%. Charts, ratios, and ratings.
August 2, 2026 · 14 min read
We analyzed all S&P 500 stocks on weekly charts and filtered out six stocks with increasing buying interest and analyst upside potential of up to 40%.
This post covers the weekly candlestick chart, key fundamental ratios, and analyst consensus for each stock. All chart data is from TradingView and all fundamental data is sourced from publicly available filings.
Before you read: If you are new to financial ratios, these guides will help you understand the tables below.
- Profitability Ratios Explained: ROE, ROA, ROCE, and Margins
- Valuation Ratios Explained: P/E, P/B, EPS, PEG, and P/S
- Solvency Ratios Explained: Debt-to-Equity, Debt Ratio, and More
- Liquidity Ratios Explained: Current Ratio, Quick Ratio, and Cash Ratio
- Efficiency Ratios Explained: Inventory, Asset, and Receivables Turnover
1. Intuit Inc. (INTU) — Fintech
Intuit is a global financial technology company specializing in personal finance, accounting, marketing, and tax preparation. Its flagship products include Mailchimp, Credit Karma, QuickBooks, and TurboTax.
The company also provides services in business management, payment processing, expert networks, and financial insights powered by generative AI.
Why is the stock down? Intuit is down more than 60% from its all-time high for several reasons. TurboTax growth has stagnated, and a guidance cut caused the stock to crash around 20% in a single day on May 21, 2026. The company also announced a massive restructuring with layoffs. In addition, the rise of generative AI in the fintech space now enables users to handle tax filing on their own, which threatens one of Intuit's core products.
However, most of these factors appear priced in.
Fundamental ratios
Valuation
| P/E (TTM) | Forward P/E | P/B | P/S | EV/EBITDA | PEG | EPS (TTM) |
|---|---|---|---|---|---|---|
| 17.74 | 10.23 | 3.93 | 4.09 | 11.77 | 0.67 | $16.56 |
Profitability
| ROE | ROA | ROIC | Gross Margin | Operating Margin | Net Margin |
|---|---|---|---|---|---|
| 22.50% | 33.30% | 20.63% | 83.94% | 23.68% | 21.19% |
Financial Health
| Current Ratio | Debt/Equity |
|---|---|
| 1.32 | 0.33 |
Weekly chart
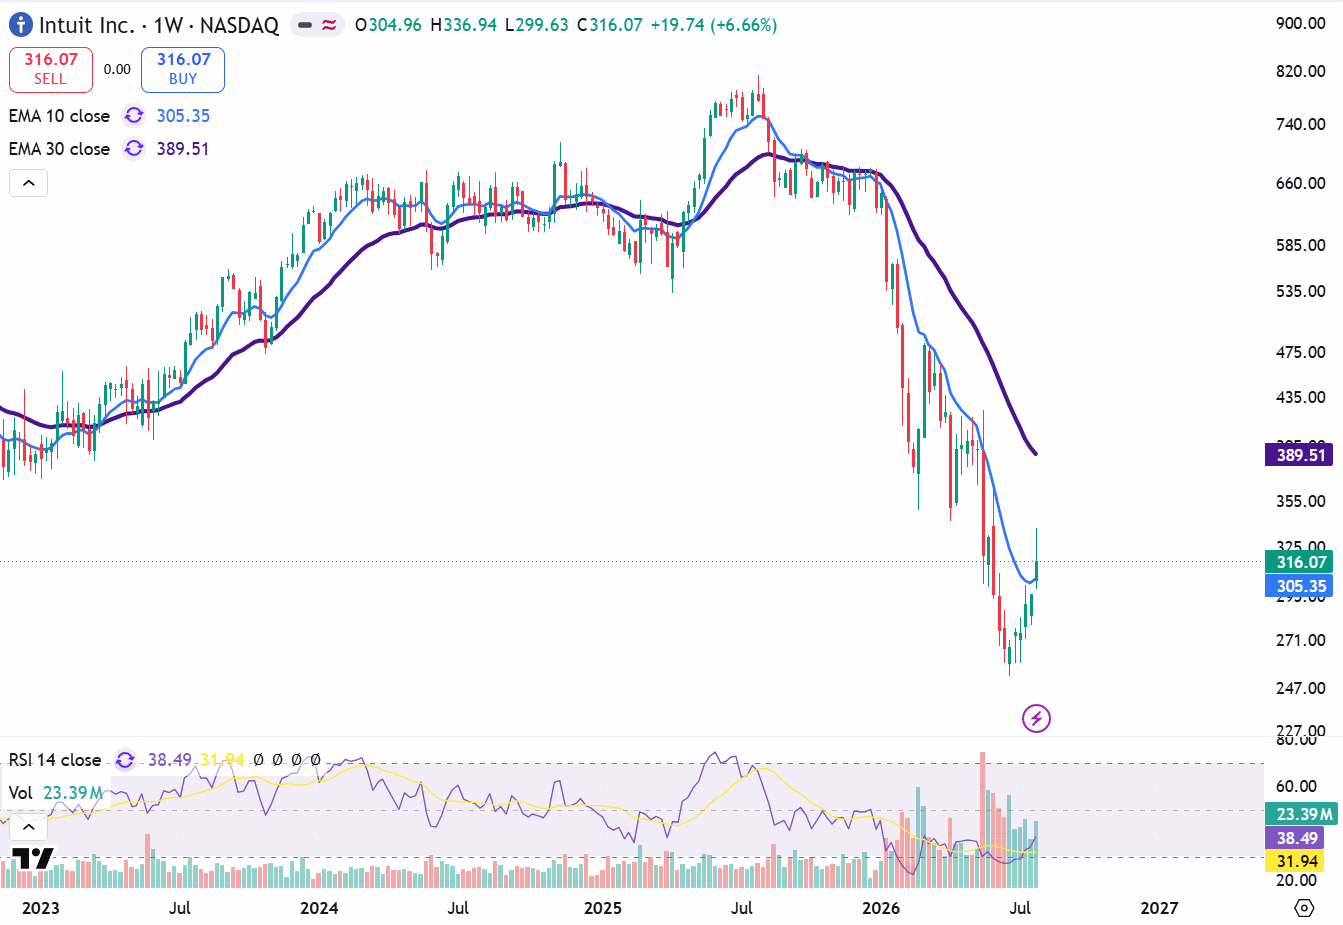
The weekly candlestick chart shows rising volume bars and supportive weekly candles, indicating growing buying interest. The stock has formed a key support level around $250. RSI has also started rising from its recent low near 25. However, the stock has already rallied about 25% from its recent low.
Analyst consensus
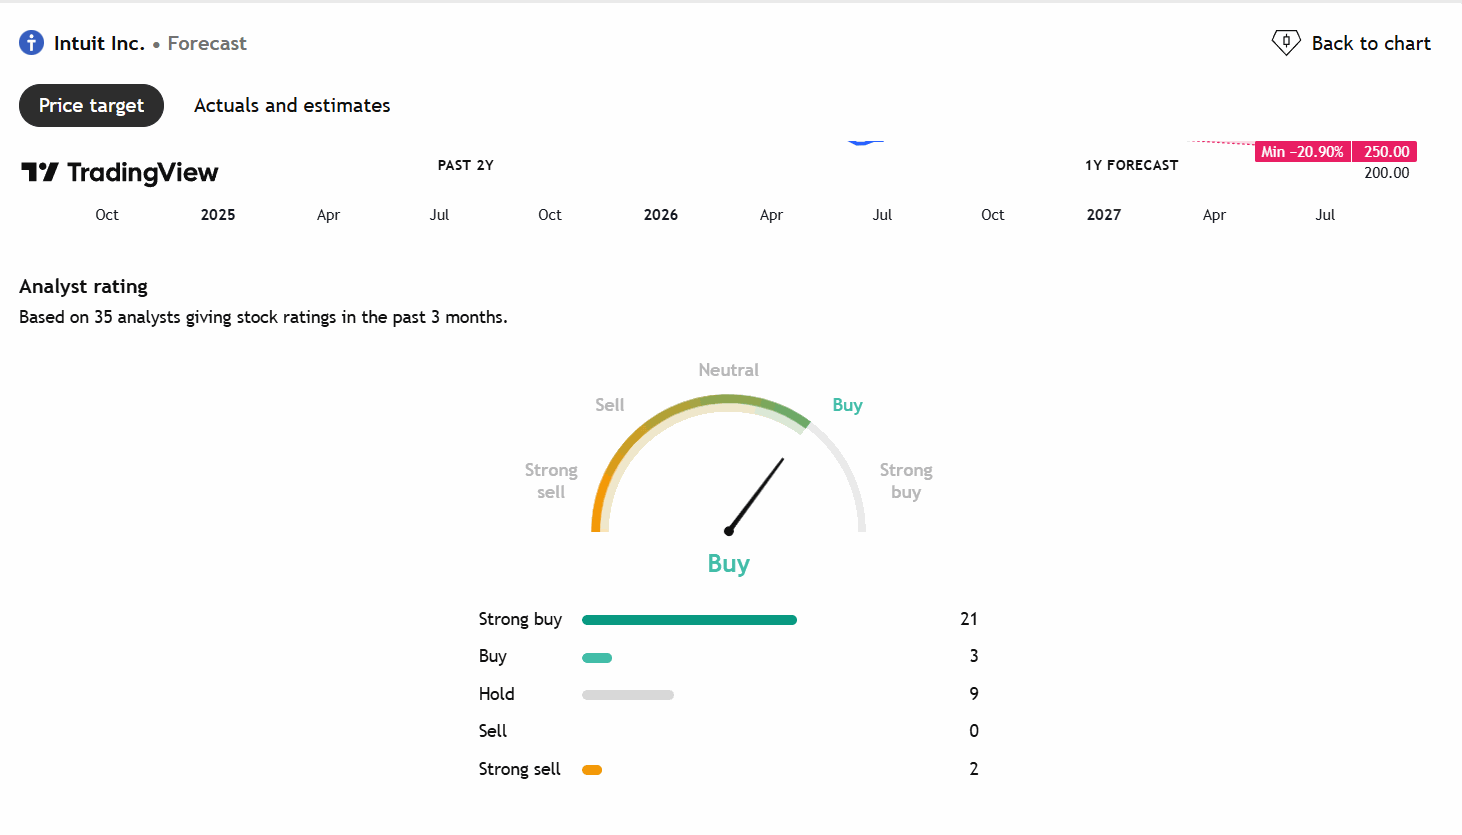
Based on the TradingView forecast report, 35 analysts have rated this stock over the last three months: 21 Strong Buy, 3 Buy, 9 Hold, and 2 Strong Sell. The consensus rating is Buy with an upside target of $443.52 (approximately 40% upside).
2. Universal Health Services (UHS) — Healthcare
Universal Health Services operates acute care hospitals, behavioral health facilities, and outpatient centers. It is headquartered in Pennsylvania with a presence across 40 U.S. states. The stock is down from its 52-week high of around $245 to a current price of $168.44. Its 52-week low is $142.50.
Why is the stock down? Labor costs and a shortage of nursing staff have pushed labor expenses to 39%, forcing the company to retain staff through premium-rate contracts. Patient volume has also dropped in the post-COVID era, and competition from peers has intensified.
Fundamental ratios
Valuation
| P/E (TTM) | Forward P/E | EV/EBITDA | Market Cap |
|---|---|---|---|
| 6.60 | 6.61 | 5.48 | $14.67B |
Profitability
| ROE | ROIC | Gross Margin | Operating Margin | Net Margin |
|---|---|---|---|---|
| 21.37% | 12.49% | 44.23% | 11.50% | 8.57% |
Financial Health
| Current Ratio | Debt/Equity |
|---|---|
| 1.08 | 0.67 |
Weekly chart
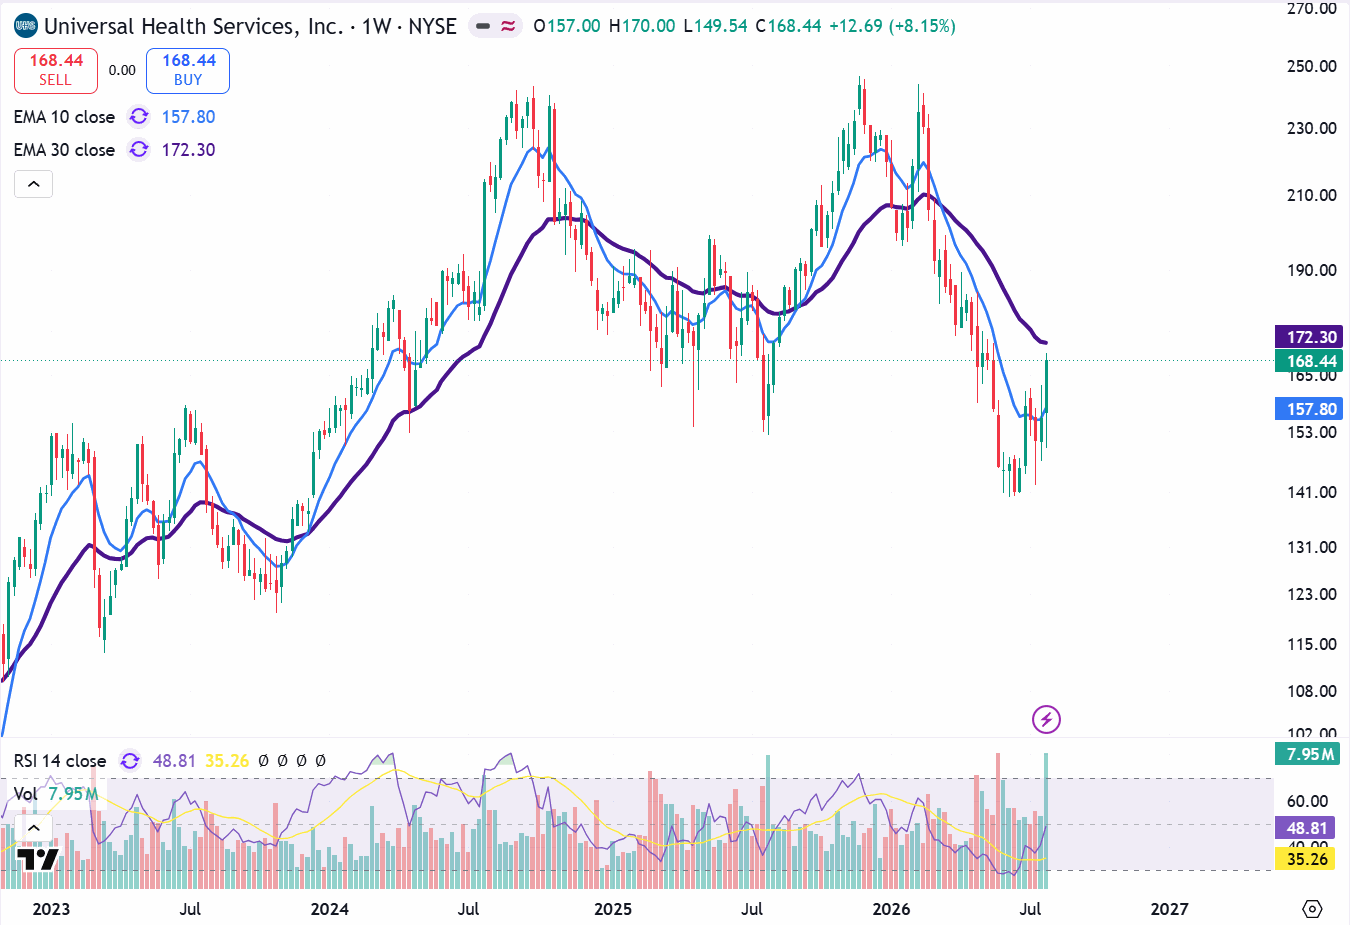
The latest weekly candle, supported by increasing volume, shows high buying interest. The weekly RSI is around 36.50.
Analyst consensus
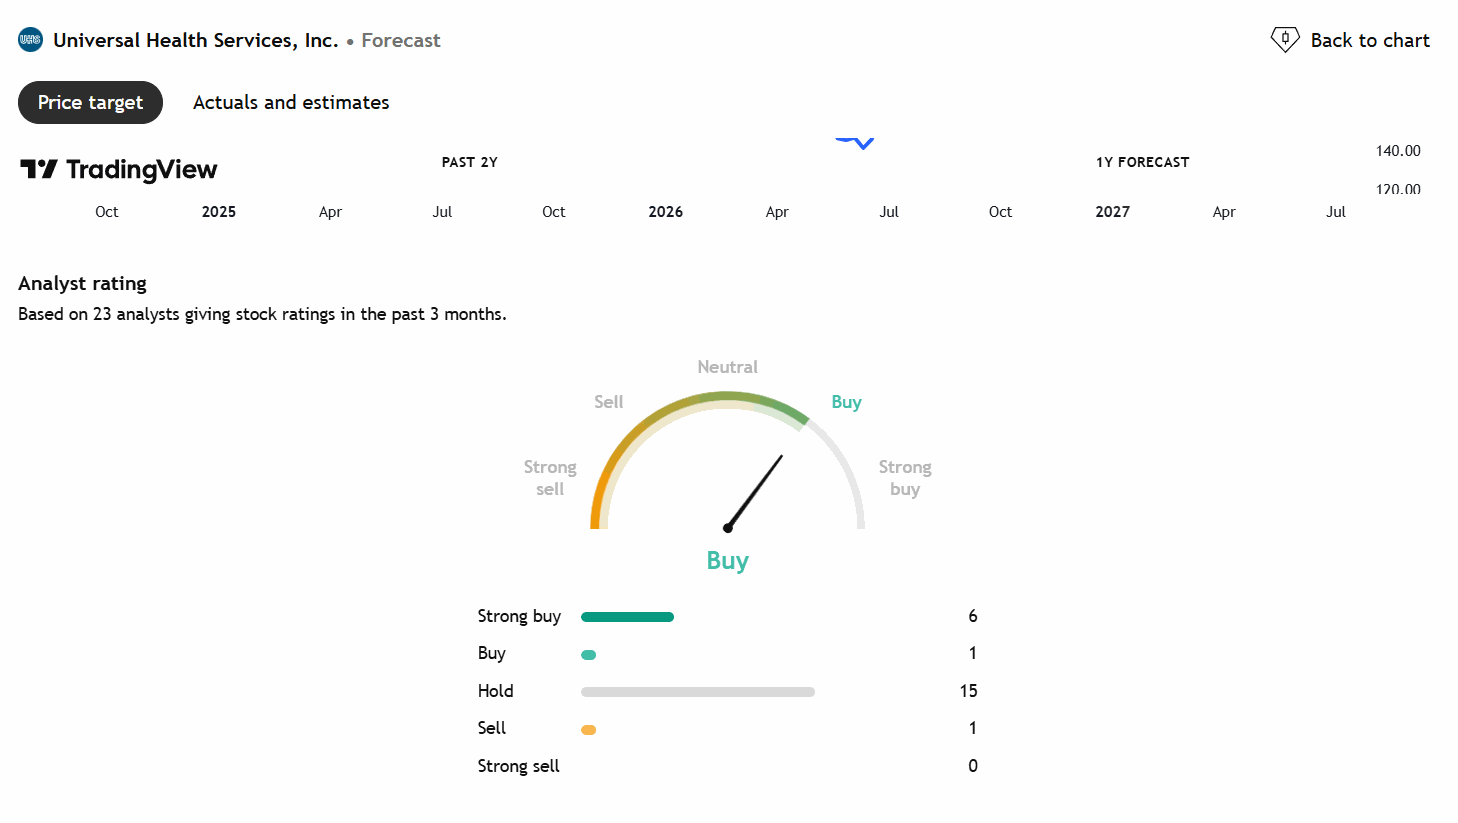
Based on 23 analysts over the past three months, 6 have Strong Buy, 1 has Buy, and 15 have Hold ratings, with 1 Sell. The consensus is Buy with an upside potential of 14.43% from the current price.
3. Boston Scientific Corporation (BSX) — Medical Devices
Boston Scientific is a global medical technology company that designs and manufactures minimally invasive medical devices across three healthcare segments: cardiovascular and electrophysiology, endoscopy, and urology and neuromodulation.
Why is the stock down? The stock declined due to slowing growth of the Watchman device, market share losses in electrophysiology, and a guidance cut. However, the company has started a restructuring program focused on cost reduction through layoffs and supply chain optimization.
Fundamental ratios
Valuation
| P/E (TTM) | Forward P/E | EV/EBITDA | PEG | EPS (TTM) |
|---|---|---|---|---|
| 17.83 | 12.98 | 13.49 | 0.85 | $2.41 |
Profitability
| ROE | ROIC | Gross Margin | Operating Margin | Net Margin |
|---|---|---|---|---|
| 14.66% | 11.13% | 68.94% | 20.60% | 17.29% |
Financial Health
| Current Ratio | Debt/Equity |
|---|---|
| 1.90 | 0.42 |
Weekly chart
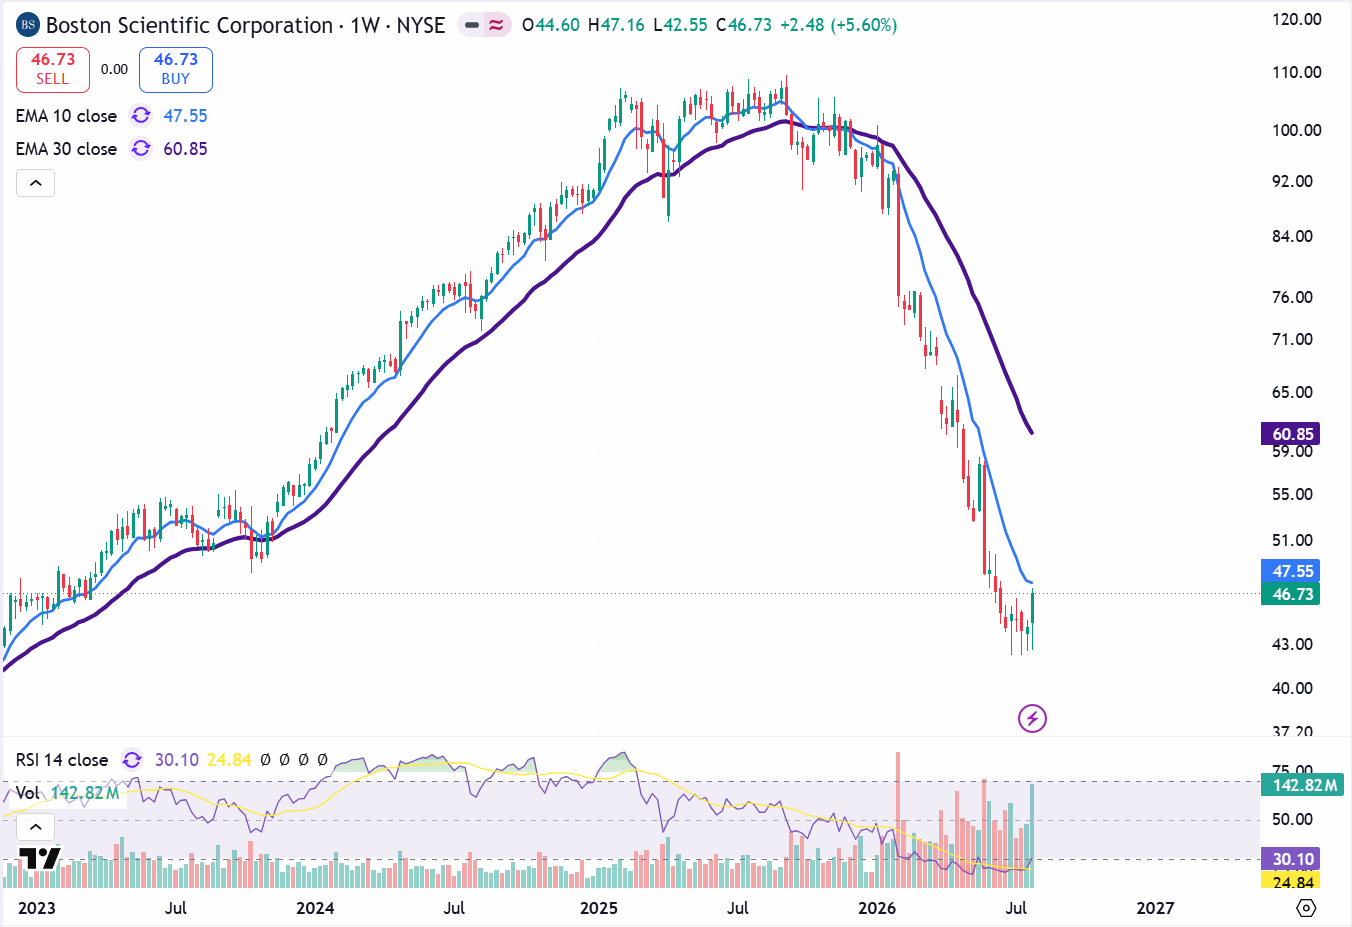
The stock is down around 60% from its all-time high. However, it has started to recover after consolidation and is near its support level around $42. Buying interest is growing. The weekly RSI has started to reverse and currently sits at 30.10.
Analyst consensus
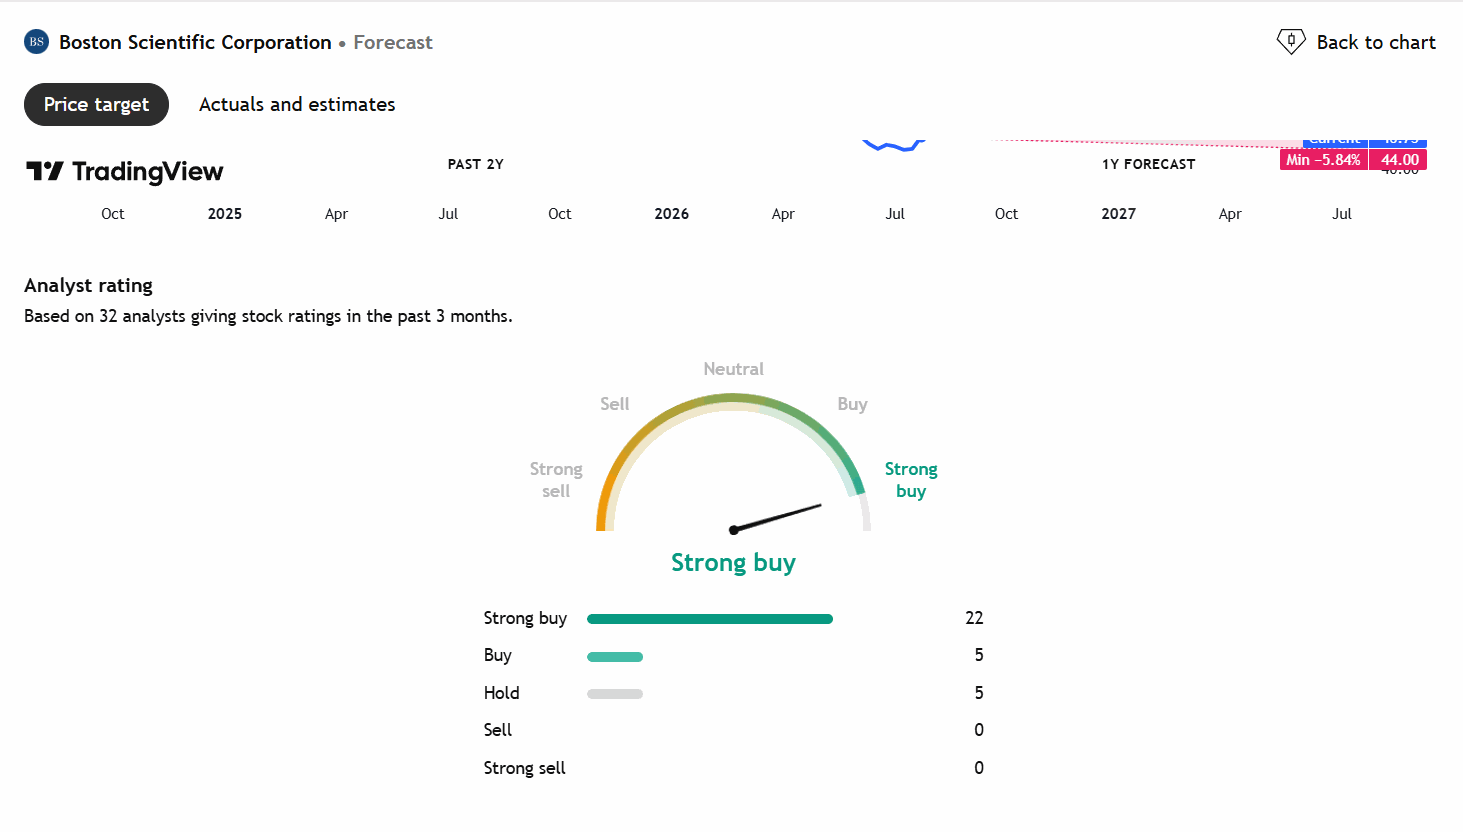
Based on 32 analysts over the past three months, 22 have Strong Buy and 5 have Buy ratings. The consensus is Strong Buy with an upside target of $61.19 (approximately 31% upside).
4. Regeneron Pharmaceuticals (REGN) — Biotechnology
Regeneron is a leading biotechnology company that discovers, develops, and commercializes medicines for serious medical conditions. Most of its revenue comes from Dupixent, Eylea, and its oncology and rare disease portfolio.
Fundamental ratios
Valuation
| P/E (TTM) | Forward P/E | EV/EBITDA | PEG | EPS (TTM) | Market Cap |
|---|---|---|---|---|---|
| 15.69 | 16.95 | 14.62 | 2.12 | $42.56 | $77.98B |
Profitability
| ROE | ROIC | Gross Margin | Operating Margin | Net Margin |
|---|---|---|---|---|
| 14.87% | 12.54% | 81.43% | 20.66% | 29.65% |
Financial Health
| Current Ratio | Debt/Equity |
|---|---|
| 4.13 | 0.10 |
Weekly chart
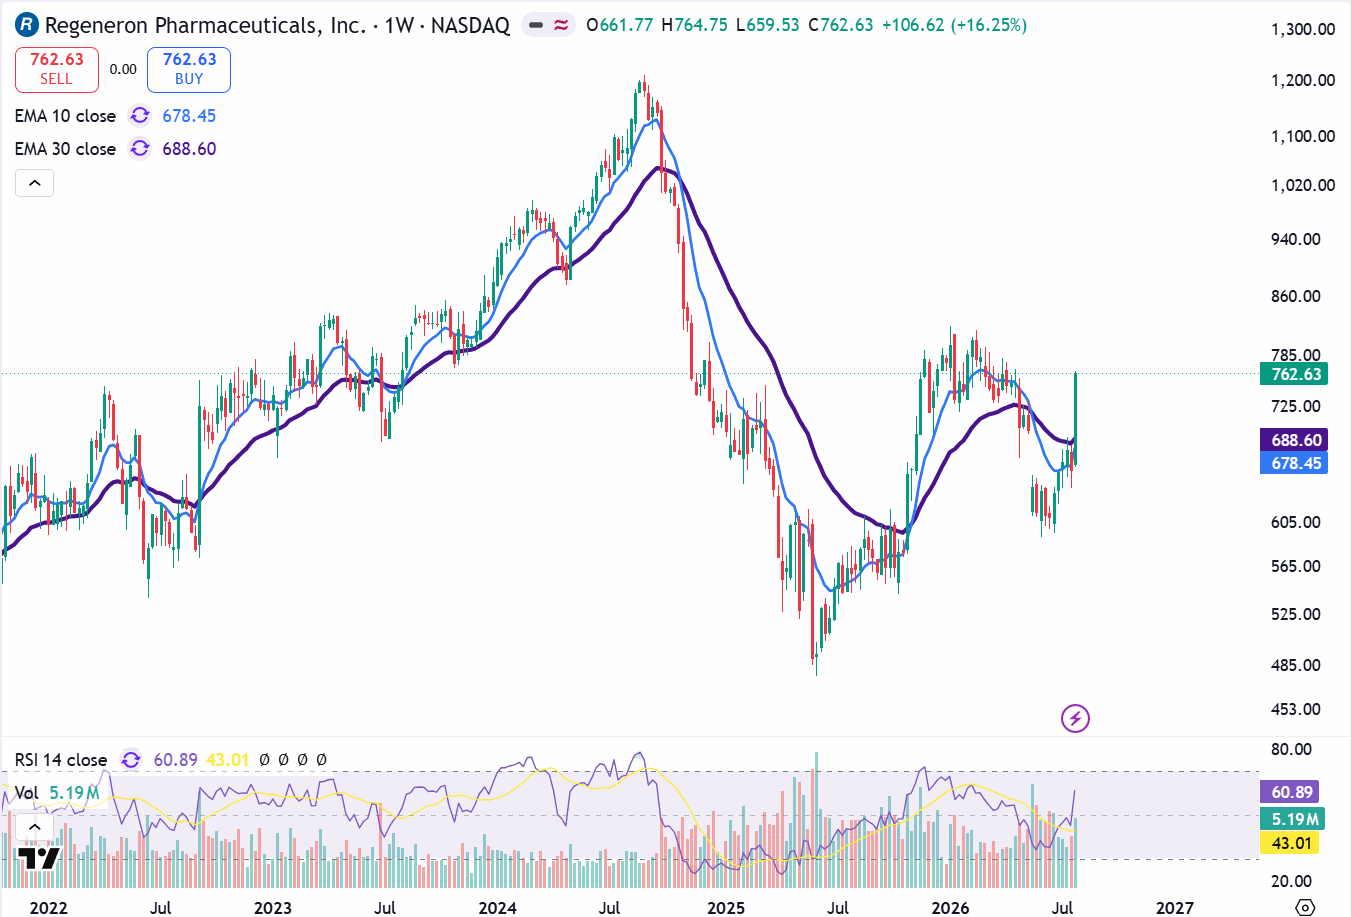
The stock's all-time high was around $1,200. After a sharp decline starting in August 2024, the stock found support around $540 in June 2025. Over the last year, the stock has returned approximately 38%, and in the last month alone, about 21%. The weekly RSI is 60.89. The stock is near its immediate resistance around $800. From the weekly chart, the stock is clearly forming higher highs.
Analyst consensus
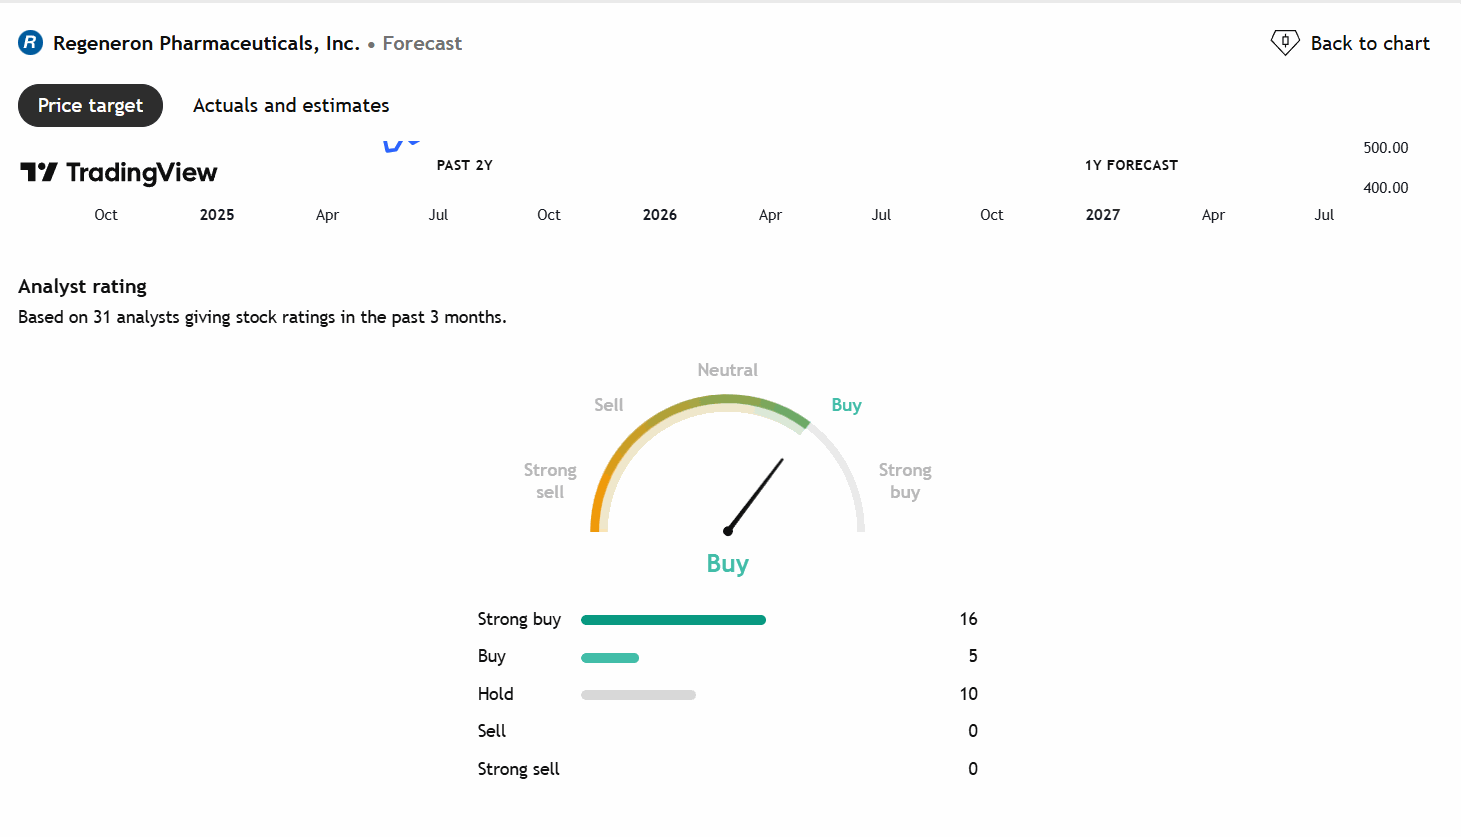
Based on 31 analysts over the past three months, 16 have Strong Buy and 5 have Buy ratings, with 10 Hold. The consensus is Buy with a one-year upside potential of approximately 9.90%.
5. PayPal Holdings (PYPL) — Digital Payments
PayPal Holdings is a global leader in digital payments that manages payment infrastructure for everyday consumers and online retailers.
Why is the stock down? PayPal is down more than 80% from its all-time high over the last five years. The decline is due to aggressive growth forecasts during the pandemic that did not materialize, increasing competition from Google Pay and Apple Pay, and growth concentrated in low-margin segments.
Fundamental ratios
Valuation
| P/E (TTM) | P/B | P/S | EV/EBITDA | PEG | EPS (TTM) |
|---|---|---|---|---|---|
| 7.73 | 2.47 | 1.27 | 7.47 | 1.45 | $5.37 |
Profitability
| ROE | ROA | ROIC | Gross Margin | Operating Margin | Net Margin |
|---|---|---|---|---|---|
| 24.50% | 5.54% | 22.96% | 40.48% | 17.83% | 14.36% |
Financial Health
| Current Ratio | Debt/Equity |
|---|---|
| 1.29 | 0.68 |
Weekly chart
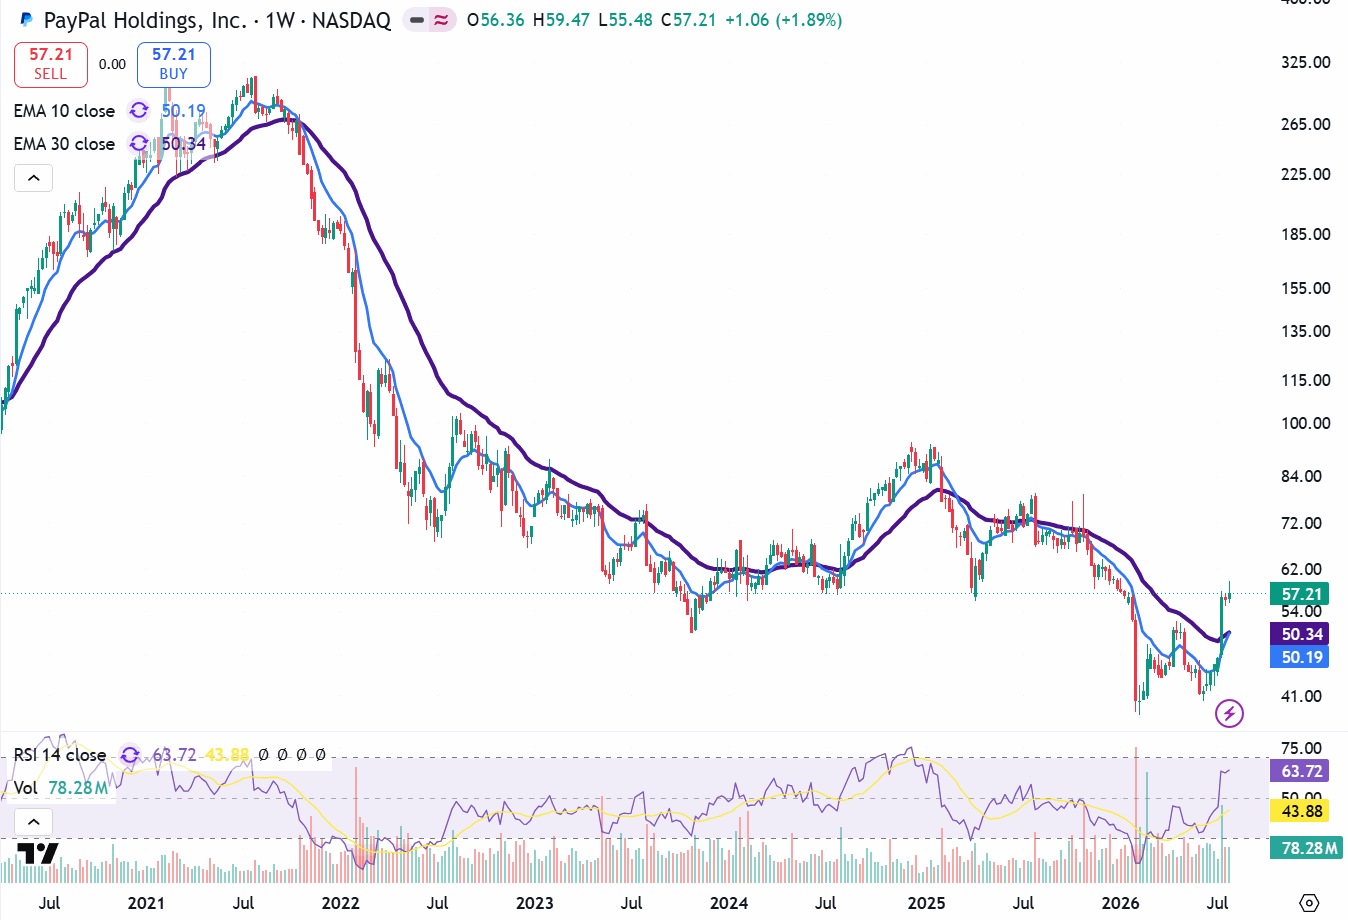
The all-time high was around $310 in July 2021. The stock found support in February 2026 at $38. The weekly chart shows a W-pattern formation, and the stock has already returned about 30% over the past year. The weekly RSI is 63.72. The stock is currently trading above some analyst targets on TradingView. However, at this valuation, the downside risk from the chart appears limited.
Analyst consensus
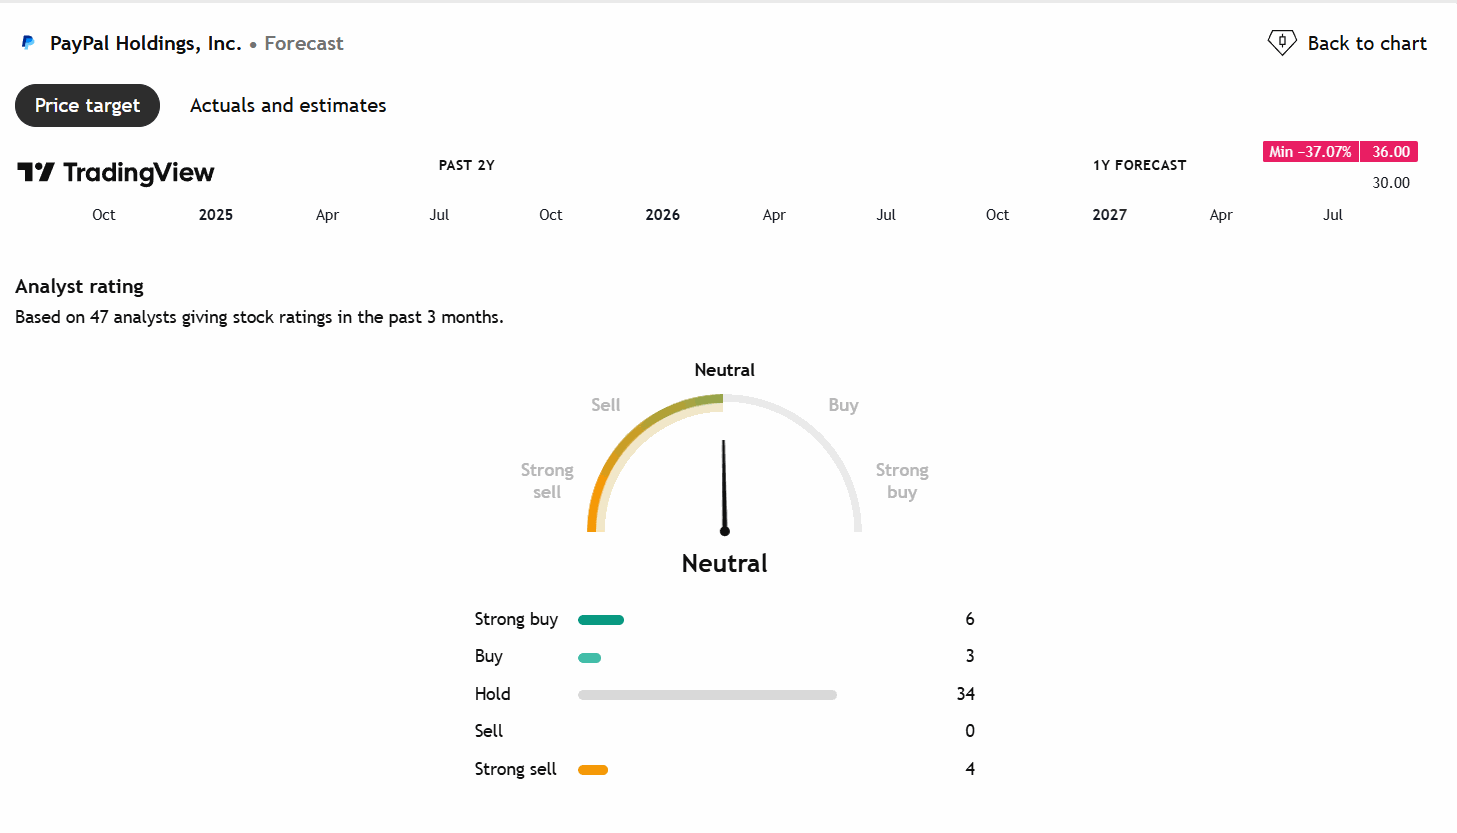
Based on 47 analysts over the past three months, 6 have Strong Buy, 3 have Buy, 34 have Hold, and 4 have Strong Sell. The consensus is Neutral.
6. Devon Energy (DVN) — Oil and Gas
Devon Energy is an energy company that operates in the exploration, development, and production of oil, natural gas, and natural gas liquids.
Why is the stock down? The stock declined from 2022 to 2025 due to a correction in the post-pandemic energy market, overproduction combined with falling natural gas prices, and rising operational costs from inflation. However, Devon recently announced a merger with Coterra Energy, which could be a significant catalyst.
Fundamental ratios
Valuation
| P/E (TTM) | Forward P/E | P/B | EV/EBITDA | EPS (TTM) | Div. Yield |
|---|---|---|---|---|---|
| 11.63 | 12.50 | 1.74 | 4.68 | $3.61 | 2.16% |
Profitability
| ROE | ROIC | Gross Margin | Operating Margin | Net Margin |
|---|---|---|---|---|
| 17.74% | 13.03% | 47.70% | 23.89% | 16.47% |
Financial Health
| Current Ratio | Debt/Equity |
|---|---|
| 0.98 | 0.55 |
Weekly chart
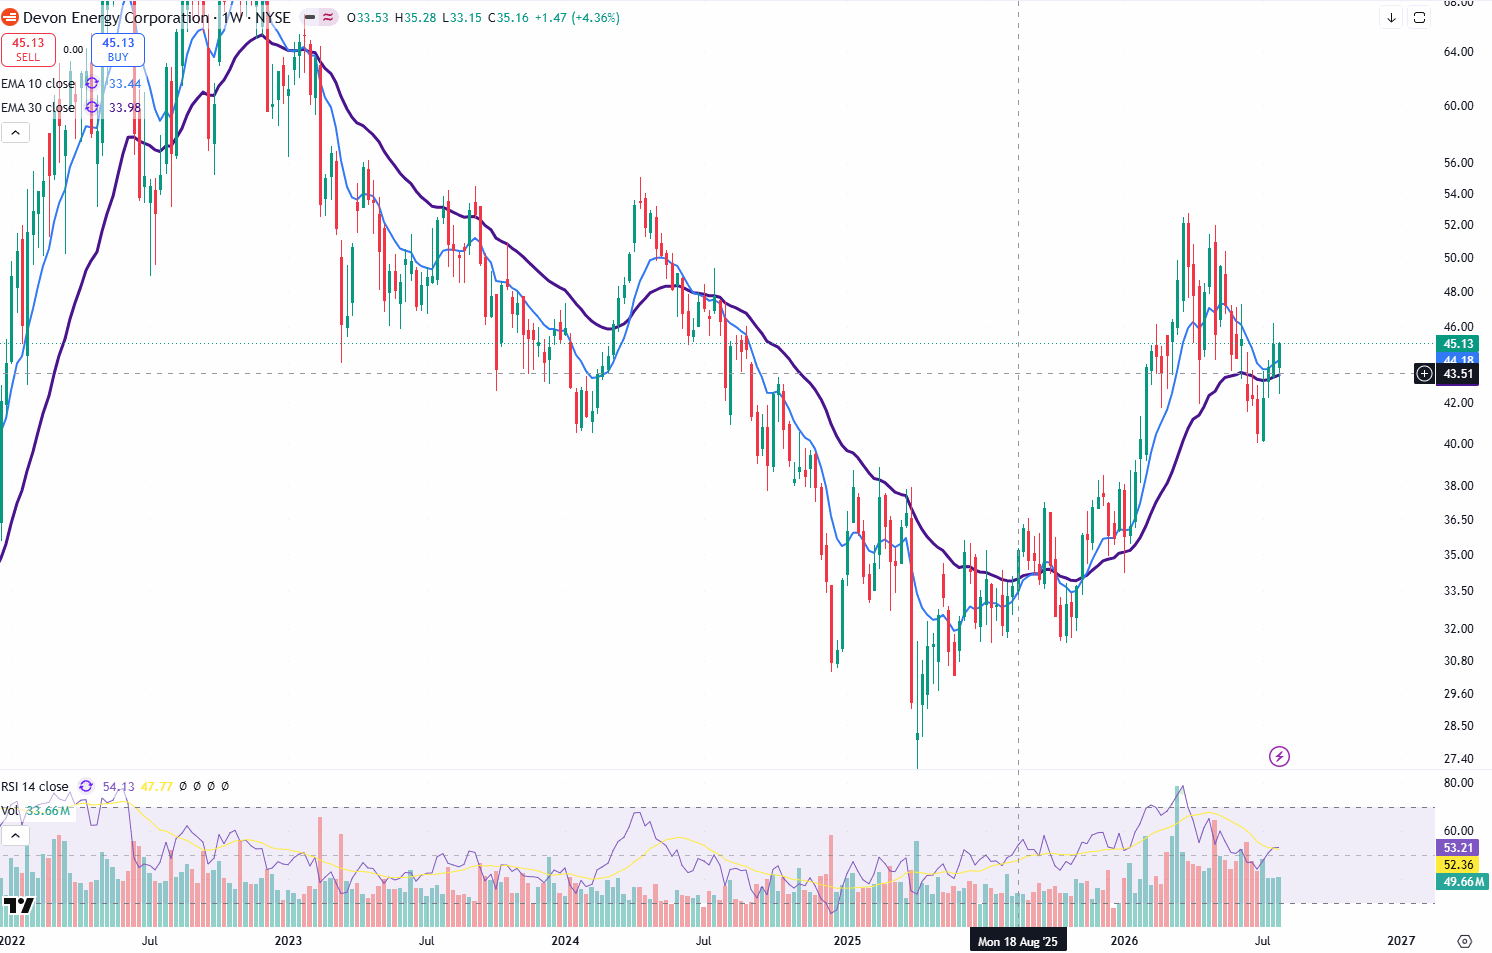
The stock found support around $26 after declining from its November 2022 high of around $79. It is currently trading around $45. The stock has returned approximately 9.89% over the past month from its recent support around $40.
Analyst consensus
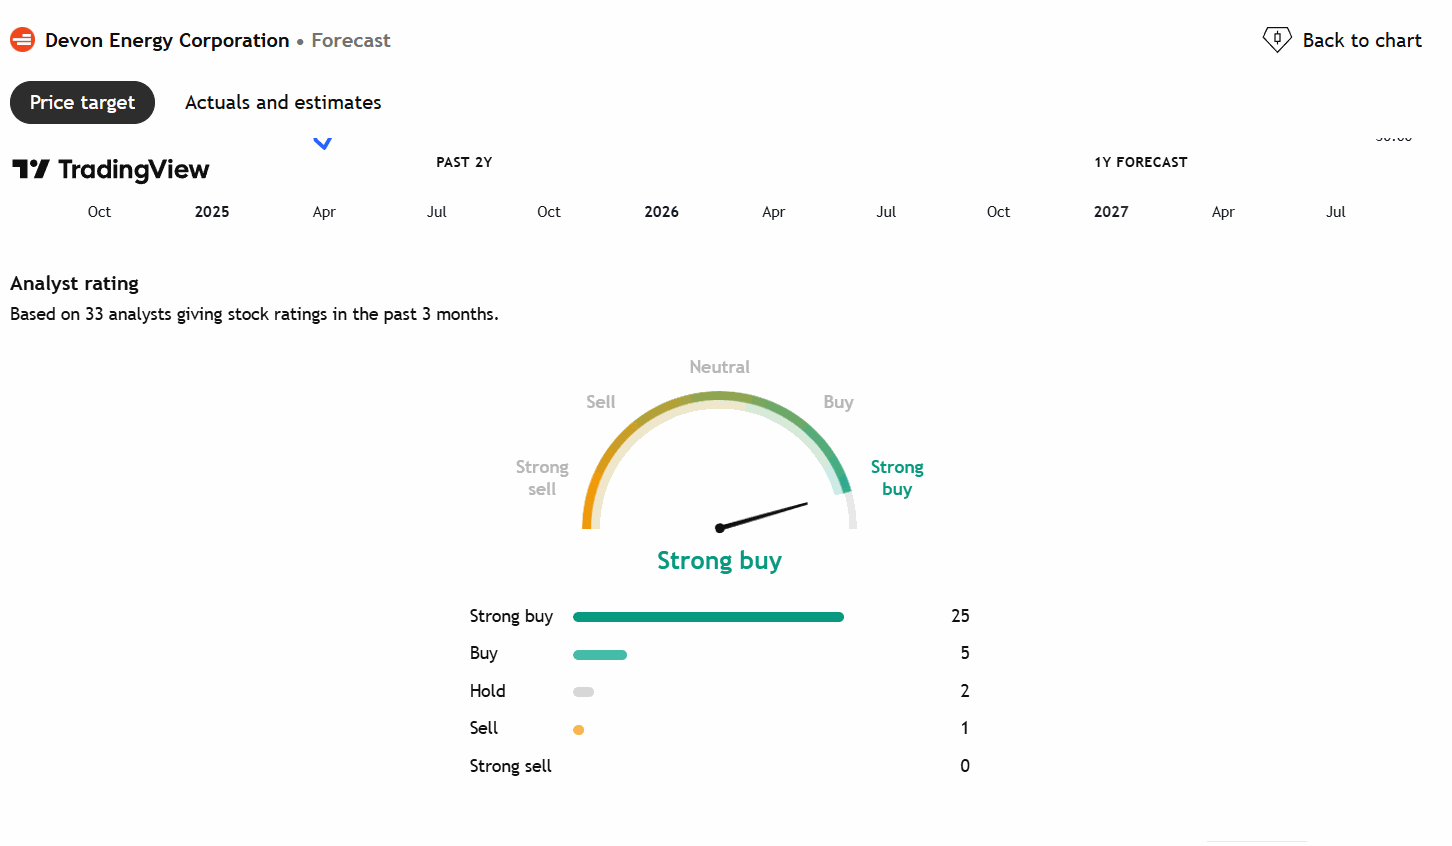
Based on 33 analysts over the past three months, 25 have Strong Buy and 5 have Buy ratings, with only 2 Hold and 1 Sell. The consensus is Strong Buy with an upside potential of 32.46% (target price around $59.78).
Summary
| Stock | Price | P/E | ROE | Gross Margin | D/E | Analyst Rating | Upside Target |
|---|---|---|---|---|---|---|---|
| Intuit (INTU) | $316.07 | 17.74 | 22.50% | 83.94% | 0.33 | Buy | 40.32% |
| UHS (UHS) | $168.44 | 6.60 | 21.37% | 44.23% | 0.67 | Buy | 14.43% |
| Boston Scientific (BSX) | $46.73 | 17.83 | 14.66% | 68.94% | 0.42 | Strong Buy | 30.95% |
| Regeneron (REGN) | $762.63 | 15.69 | 14.87% | 81.43% | 0.10 | Buy | 9.90% |
| PayPal (PYPL) | $57.21 | 7.73 | 24.50% | 40.48% | 0.68 | Neutral | — |
| Devon Energy (DVN) | $45.13 | 11.63 | 17.74% | 47.70% | 0.55 | Strong Buy | 32.46% |
Sources and references
- Weekly charts and analyst ratings: TradingView
- Fundamental ratios: Stock Analysis, GuruFocus, MacroTrends
- Company filings: SEC EDGAR
Disclaimer: This article is for educational and informational purposes only. It is not financial advice and should not be treated as a recommendation to buy or sell any stock. All investments carry risk, including the potential loss of principal. Always do your own research or consult a licensed financial advisor before making investment decisions. Past performance does not guarantee future results.
- #S&P 500
- #Swing Trading
- #Swing Trading Setups
- #Weekly Chart Analysis
- #Stock Screening
- #Intuit Stock
- #PayPal Stock
- #Boston Scientific Stock
- #Regeneron Stock
- #Devon Energy Stock
- #Universal Health Services Stock
- #Stock Analysis
- #EMA Crossover
- #Technical Analysis
- #Fundamental Analysis
- #Analyst Ratings
- #Stock Market
- #RSI
- #Volume Analysis
- #Financial Ratios
- #Valuation Ratios
- #Profitability Ratios
- #Buying Setup
- #US Stock Market
- #US Stocks
- #Stock Market August 2026
- #Value Stocks
- #Growth Stocks
Related articles

Investing13 min read

Investing15 min read

Investing16 min read
Stay ahead on finance & AI
Weekly articles on personal finance, investing strategies, and how AI is changing the way we manage money. Free. No spam.
Join free · Unsubscribe anytime · We never share your email.