Eternal vs Swiggy Q2 FY27: Blinkit Earns, Instamart Burns
Eternal vs Swiggy Q2 FY27: Blinkit earned Rs 184 Cr while Instamart lost Rs 895 Cr. Results, valuation, analyst targets, plans, risks and charts.
· 14 min read
Eternal (Zomato's parent) reported its Q2 FY27 results on October 21, 2026, and Swiggy on October 22. Both run food delivery and quick commerce, but only one of them makes money.
In short: Eternal's adjusted EBITDA rose to Rs 666 Cr, and Blinkit earned Rs 184 Cr. Swiggy's adjusted EBITDA loss widened to Rs 760 Cr because Instamart lost Rs 895 Cr. Swiggy fell 16.7% the next day to a record low. This post compares the numbers. It does not tell you which to buy.
Prices are the NSE close on October 26, 2026.
What Do Eternal and Swiggy Do?
| Business | Eternal | Swiggy |
|---|---|---|
| Food delivery | Zomato | Swiggy, plus Toing (budget meals) |
| Quick commerce | Blinkit | Instamart |
| Going out | District (dining, events, movies) | Dineout and Scenes |
| Other | Hyperpure (restaurant supplies), Bistro, Nugget | Lynks (distribution, sold to Udaan in September) |
Q2 FY27 Results Side by Side
| Metric | Eternal | Swiggy |
|---|---|---|
| Revenue from operations | Rs 24,138 Cr | Rs 7,571 Cr |
| Revenue growth (YoY) | +77.6% | +36.1% |
| Consumer order value | Rs 35,644 Cr | Rs 20,793 Cr |
| Order value growth (YoY) | +53.9% | +24.6% |
| Adjusted EBITDA | Rs 666 Cr | −Rs 760 Cr |
| Net profit | Rs 125 Cr | −Rs 922 Cr |
| Net profit a year ago | Rs 65 Cr | −Rs 1,092 Cr |
| Cash on September 30 | Rs 16,475 Cr | Rs 13,662 Cr |
Blinkit now owns its inventory and books the full sale value, not just a commission, so Eternal's revenue grew faster than its business. Like-for-like, its adjusted revenue grew 58%. Eternal reports net order value (NOV, after discounts). Swiggy's headline is gross order value (GOV, before discounts), which flatters Swiggy slightly.
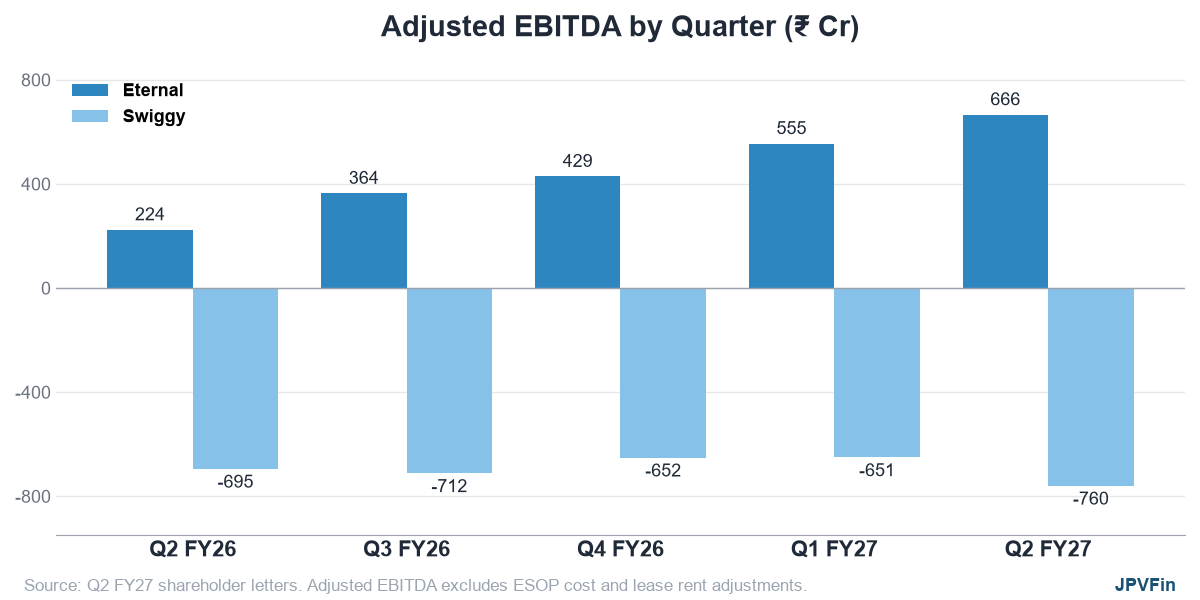
Eternal's adjusted EBITDA has risen for five straight quarters and tripled in a year. Swiggy's loss narrowed through FY26 but widened again this quarter. Its net loss is smaller than a year ago, but 17% bigger than Q1's Rs 791 Cr.
Food Delivery: Zomato Still Ahead
| Metric | Zomato | Swiggy |
|---|---|---|
| Order value | Rs 11,445 Cr (NOV) | Rs 10,054 Cr (GOV) |
| Growth (YoY) | +21.5% | +17.7% |
| Adjusted EBITDA | Rs 627 Cr | Rs 341 Cr |
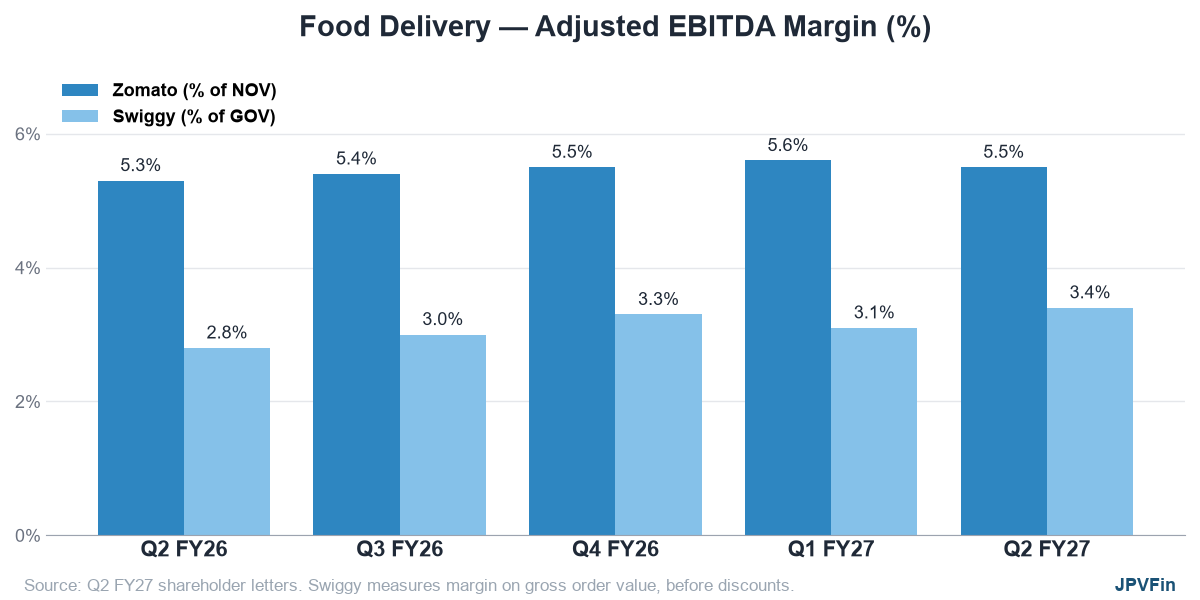
| Adjusted EBITDA margin | 5.5% of NOV | 3.4% of GOV |
| Monthly transacting users | 28.0 million | 19.8 million |
Zomato's growth has sped up for five quarters in a row, and it earns nearly twice Swiggy's profit from food. Swiggy is narrowing the margin gap. Its margin reached a record 3.4%, helped by advertising income and short-distance orders through Bolt and the 99 Store. Its food profit grew 42% from a year ago, against 25% for Zomato, whose margin has held near 5.5% for a year.
Quick Commerce: Blinkit Earns, Instamart Burns
| Metric | Blinkit | Instamart |
|---|---|---|
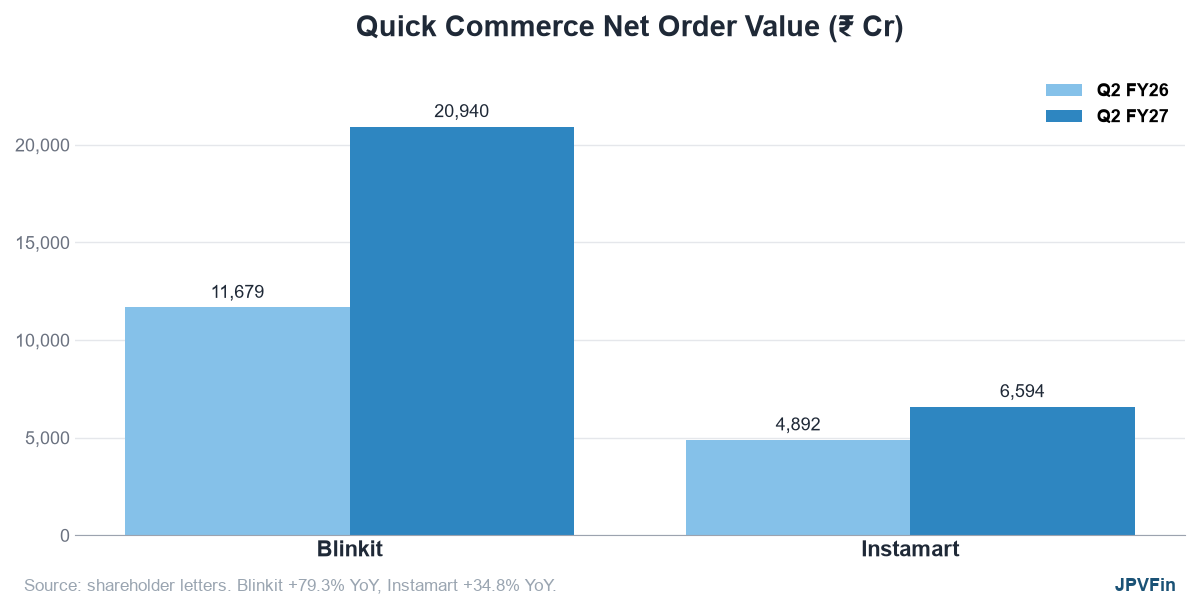
| Net order value | Rs 20,940 Cr | Rs 6,594 Cr |
| Growth (YoY) | +79.3% | +34.8% |
| Orders | 398.9 million | 130.3 million |
| Net average order value | Rs 525 | Rs 506 |
| Monthly transacting users | 37.0 million | 14.8 million |
| Dark stores | 2,751 | 1,240 |
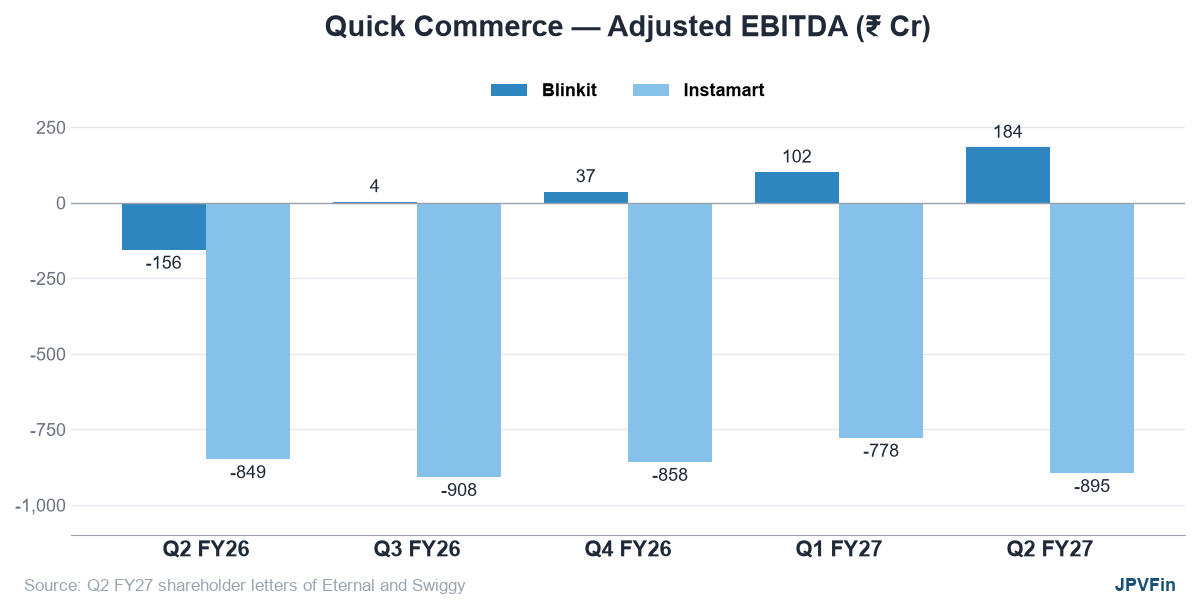
| Adjusted EBITDA | Rs 184 Cr | −Rs 895 Cr |
| Adjusted EBITDA margin | +0.9% of NOV | −9.7% of GOV |
Blinkit is now 3.2 times Instamart by order value, up from 2.4 times a year ago. It has made an adjusted profit for four straight quarters. Instamart's loss grew by Rs 118 Cr from Q1 because Swiggy spent on discounts to win back dormant users, such as a Rs 9 store, and opened 69 stores. Its growth did pick up: order value rose 13.4% from Q1, against 2.5% in the quarter before.
Going Out and Other Businesses
- District (Eternal): order value Rs 3,259 Cr, up 58%. Its loss was Rs 64 Cr, flat from Q1.
- Swiggy out-of-home: order value Rs 1,508 Cr, up 34.9%, and a Rs 8 Cr profit, its seventh profitable quarter in a row.
- Hyperpure (Eternal): revenue Rs 1,154 Cr and a Rs 10 Cr profit. Bistro and Nugget lost Rs 91 Cr.
- Swiggy's new bets, including Toing, lost Rs 162 Cr, and the distribution business lost Rs 51 Cr.
Market Expectations vs Reality
| Estimate | Actual | Reading | |
|---|---|---|---|
| Eternal revenue | Rs 23,447 Cr | Rs 24,138 Cr | Beat |
| Eternal EBITDA (reported) | Rs 776 Cr | Rs 752 Cr | Slight miss |
| Eternal net profit | Rs 304 Cr | Rs 125 Cr | Big miss |
| Swiggy net loss | About Rs 870 Cr | Rs 922 Cr | 5.9% worse |
Sources: News Karnataka (Eternal) and Trendlyne (Swiggy; the estimate is implied by its 5.9% miss).
Eternal fell 2.5% on October 22 but closed at Rs 325.55 on October 26, 4.2% above its results-day close. Swiggy fell 16.7% on October 23 to Rs 176, then rose 5.5% on October 26.
The reasons differ. Eternal's operating numbers were close to estimates, and the big gap was in net profit. Tax took Rs 198 Cr of its Rs 323 Cr pre-tax profit, because the parent company uses up its past losses this year while Blinkit's and District's losses sit in subsidiaries. Swiggy's miss came from the business itself.
What Does Management Expect?
| Eternal | Swiggy | |
|---|---|---|
| Food delivery growth | 20%+ a year over the long term | 18–20% in FY27, excluding Toing |
| Food delivery margin | No target given | 5% adjusted EBITDA margin at steady state |
| Quick commerce growth | 60% a year for three years, tracking ahead | Double-digit growth from Q2 to Q3 again |
| Quick commerce margin | Rising; mature cities already above 5% | Losses peaked in Q2; margin up about 1 percentage point in Q3 |
| Stores | 3,500+ by March 2027, about 5,000 by March 2028 | 69 added in Q2; no target given |
| Going out | District at breakeven within 4–6 quarters of January 2026; Rs 1,400 Cr EBITDA by FY30 | Margin moving toward 5% |
| Group | No group target | Rs 10,000 Cr adjusted EBITDA by FY31 |
The two companies are taking different routes to quick commerce margins:
- Private labels: Swiggy's No!ce brand is in 1 in 8 Instamart orders, and its buyers come back more often. Blinkit says its own label would compete with the brands it sells and would not pay off.
- Inventory: Blinkit already owns its stock. Swiggy capped foreign ownership at 49.5% so Instamart can do the same. The switch starts mid-Q3 and should add about 0.8 percentage points to contribution margin.
- Scale: Swiggy says Instamart breaks even at about 2.3 times today's size, Rs 60,000 Cr of yearly order value, with Rs 30 of contribution per order.
- New bets: Eternal plans to launch dark.ai, a private AI assistant, within 2026. Swiggy says Toing could lift its combined food growth to 25–30%.
These are management statements from the shareholder letters, not guarantees.
Fundamentals: Profit, Cash and Balance Sheet
| Last 12 months | Eternal | Swiggy |
|---|---|---|
| Revenue | Rs 77,956 Cr | Rs 26,914 Cr |
| Adjusted EBITDA | Rs 2,014 Cr | −Rs 2,775 Cr |
| Net profit | Rs 493 Cr | −Rs 3,578 Cr |
| Return on equity (FY26) | 0.4% | −29.1% |
| Cash burn in Q2 (before working capital) | Rs 350 Cr | Rs 708 Cr |
| Change in cash in Q2 | −Rs 1,813 Cr | −Rs 705 Cr |
Eternal's cash fell mainly because Blinkit stocked up for the festive season (Rs 1,463 Cr of working capital) and capital spending rose to Rs 941 Cr. Swiggy's burn comes from operating losses. It raised Rs 9,931 Cr in the December 2025 quarter and sold its Rapido stake for Rs 2,399 Cr, so at Q2's pace its cash covers about 19 quarters.
Valuation: What Is the Market Paying For?
| Metric | Eternal | Swiggy |
|---|---|---|
| Price | Rs 325.55 | Rs 185.75 |
| Market cap | Rs 3,14,564 Cr | Rs 51,070 Cr |
| Enterprise value (market cap minus cash) | Rs 2,98,089 Cr | Rs 37,408 Cr |
| EV / yearly order value | 2.1x | 0.45x |
| Price / book | 10.0x | 3.0x |
| P/E (trailing) | 638x | Loss-making |
| 52-week high / low | Rs 344 / Rs 213 | Rs 434 / Rs 174 |
| 1-year price change | −0.3% | −56.3% |
Market cap and P/E from Screener. Yearly order value is Q2 consumer order value times four (NOV for Eternal, GOV for Swiggy).
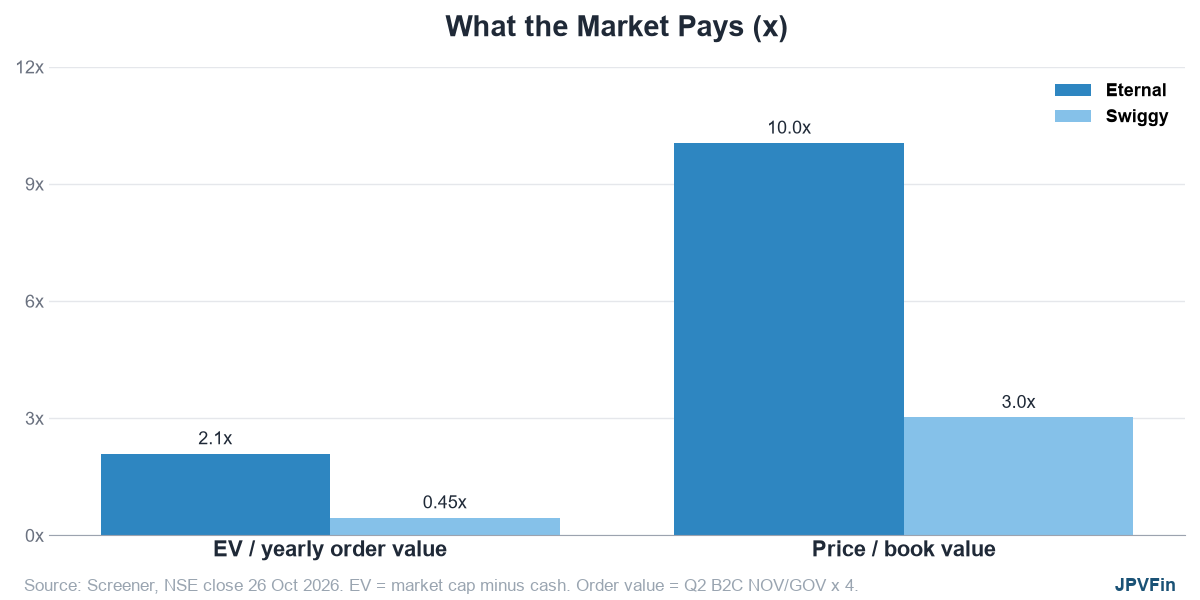
Eternal's market cap is six times Swiggy's, though its order value is only 1.7 times. The gap is the price of profit: Blinkit makes money, while Instamart loses about Rs 900 Cr a quarter. Eternal's P/E of 638x looks extreme because its reported profit is cut by tax and by losses in newer businesses. Swiggy's enterprise value is now less than three times its cash. These measures look backward and are not forecasts.
What Do Brokerages Say?
Eternal (notes of October 21–22)
| Brokerage | Rating | Target | Upside |
|---|---|---|---|
| Jefferies | Buy | Rs 430 | +32.1% |
| ICICI Securities | Buy | Rs 425 | +30.5% |
| JPMorgan | Overweight | Rs 420 | +29.0% |
| Motilal Oswal | Buy | Rs 420 | +29.0% |
| Emkay | Buy | Rs 420 | +29.0% |
| UBS | Buy | Rs 390 | +19.8% |
| Axis Direct | Buy | Rs 390 | +19.8% |
| Macquarie | Underperform | Rs 225 | −30.9% |
Swiggy (notes of October 22–23; most targets were cut)
| Brokerage | Rating | Target | Upside |
|---|---|---|---|
| ICICI Securities | Buy | Rs 400 (from Rs 520) | +115.3% |
| Motilal Oswal | Buy | Rs 280 (from Rs 350) | +50.7% |
| Goldman Sachs | Equalweight | Rs 263 (from Rs 328) | +41.6% |
| HSBC | — | Rs 240 (from Rs 315) | +29.2% |
| Macquarie | — | Rs 230 | +23.8% |
| Ambit Capital | — | Rs 220 | +18.4% |
| JM Financial | — | Rs 200 | +7.7% |
Upside is from the October 26 close. "—" means the rating was not given in the report we found. Sources: Trendlyne (Eternal), News Karnataka, Trendlyne (Swiggy), and Business Today.
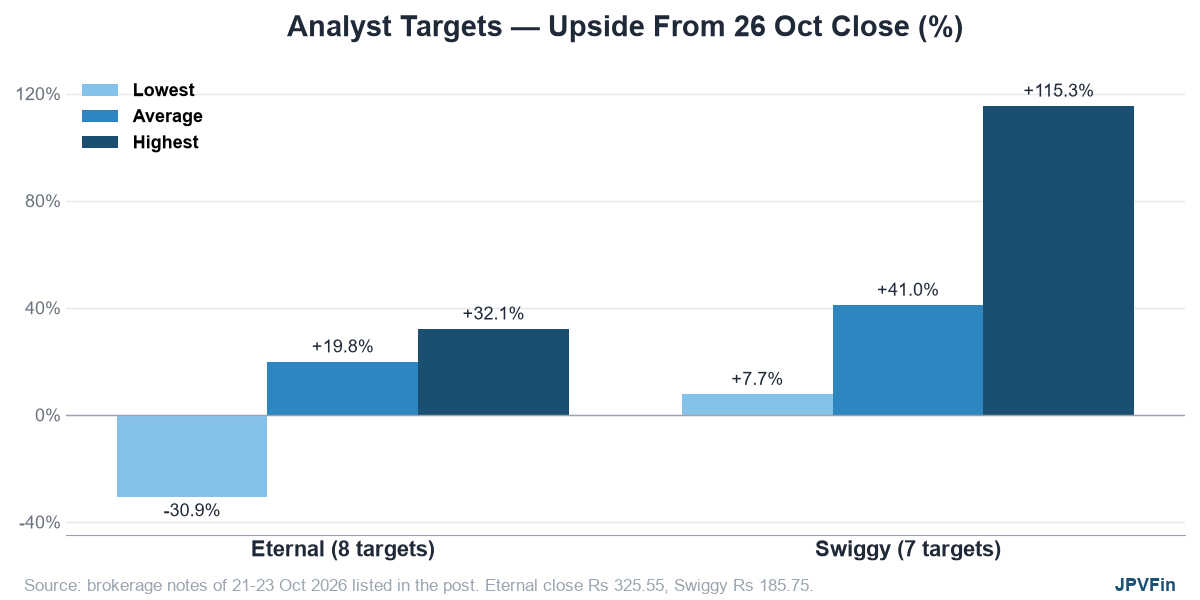
The average Eternal target, Rs 390, is 19.8% above the price, and seven of eight notes are positive. Macquarie is the outlier: it says the price already reflects the progress. For Swiggy, the average target of about Rs 262 is 41% above the price, but ICICI Securities' Rs 400 pulls it up. The median is Rs 240 (+29%). The stock now trades below even the lowest target, JM Financial's Rs 200.
Competition and Risks
Competition is getting harder in both businesses.
- Zepto: It processed 640.2 million orders in FY26, against 916.6 million for Blinkit and 412.2 million for Instamart. Instamart's share of the three players' orders fell to 20.9% in FY26 from 34.3% in FY24, according to Zepto's draft IPO prospectus (Apparel Resources). Zepto plans to raise Rs 8,010 Cr of fresh capital, mostly for dark stores (Outlook Money).
- Flipkart Minutes: 1,000 stores across 130 cities by June 2026, adding about 100 a month toward 1,500 (Outlook Business). Swiggy expects e-commerce majors to keep competing hard through the festive quarter.
- Rapido's Ownly: zero-commission food delivery in Bengaluru and Hyderabad, with plans to reach all metros by December (ThePrint).
Risks for Eternal
- Valuation: 638x trailing earnings and 10x book leave little room for a miss.
- Expansion: about 750 new stores by March weigh on margins in their first months.
- Tax: more of its profit goes to tax from FY27.
- GST: disputes on delivery charges total about Rs 553 Cr, plus interest and penalties. Eternal is contesting them, and its auditor flagged the matter.
Risks for Swiggy
- Losses: Instamart needs about 2.3 times its current scale to break even.
- Market share: it keeps losing quick commerce share to Blinkit and Zepto.
- Execution: the inventory switch and Toing's spending both carry risk.
For both: the new labour codes, including social security for gig workers, are not yet fully in force. Eternal says the parts in force today have no material impact.
What Do the Weekly Charts Say?
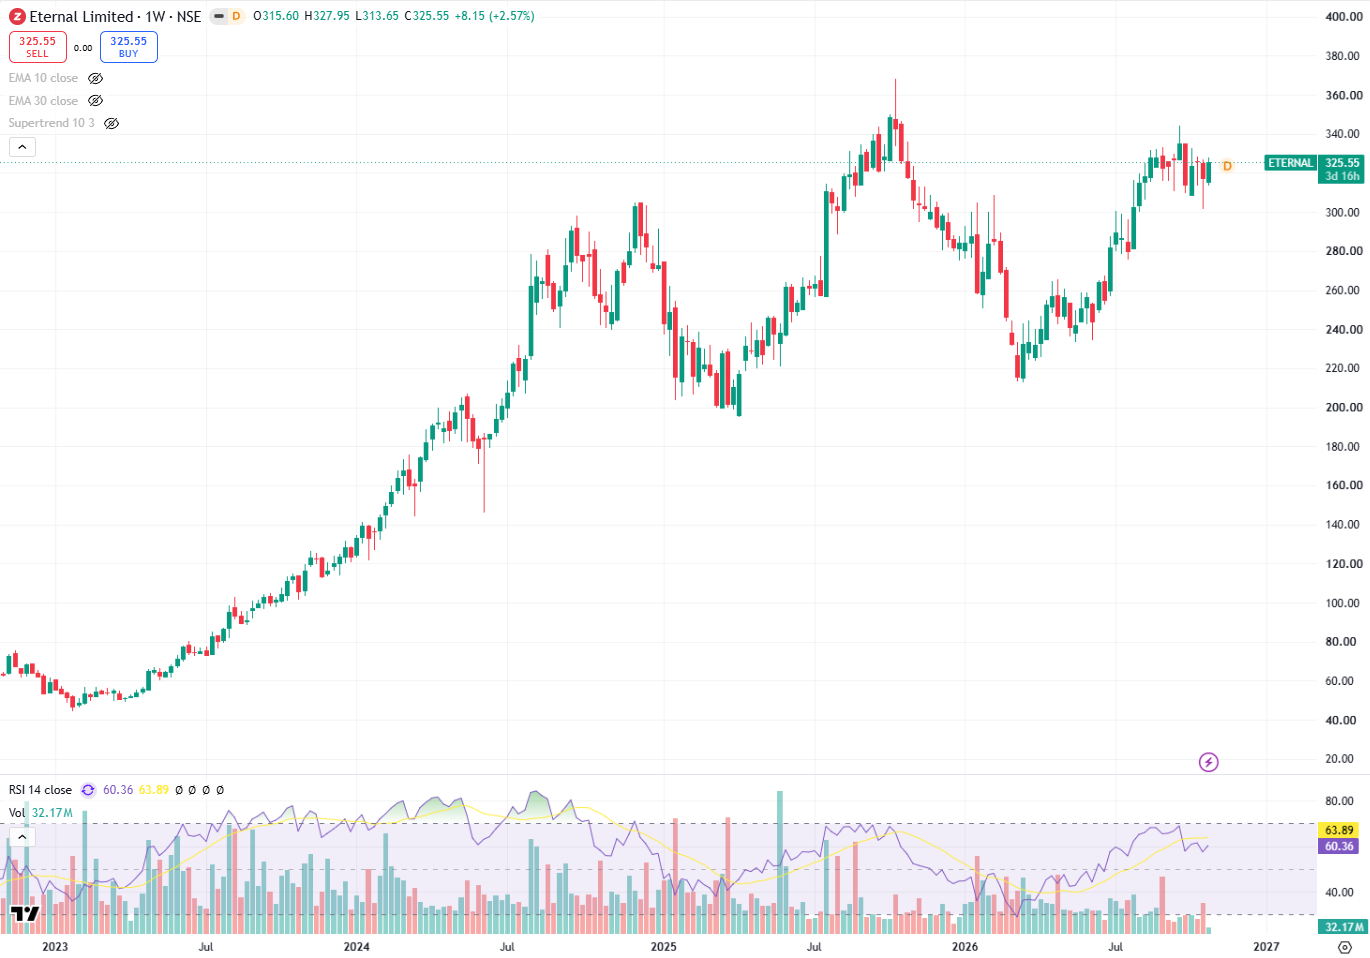
Eternal at Rs 325.55 is 11.6% below its record high of Rs 368.45 (October 16, 2025) and 53% above its 52-week low of Rs 212.60 (March 16, 2026). It trades above its 10-week (Rs 320) and 30-week (Rs 300) averages and its 200-day average (Rs 279). Weekly RSI is 60. It has moved between Rs 294 and Rs 344 for three months.
Swiggy at Rs 185.75 is 70% below its record high of Rs 617.30 (December 23, 2024) and 52% below its IPO price of Rs 390. It touched a lifetime low of Rs 174.20 on October 26 before closing up 5.5%. It trades far below its 10-week (Rs 231) and 30-week (Rs 263) averages and its 200-day average (Rs 280). Weekly RSI is 27.9. Chart readers call a reading below 30 oversold, but that describes how fast the price fell, not where it goes next.
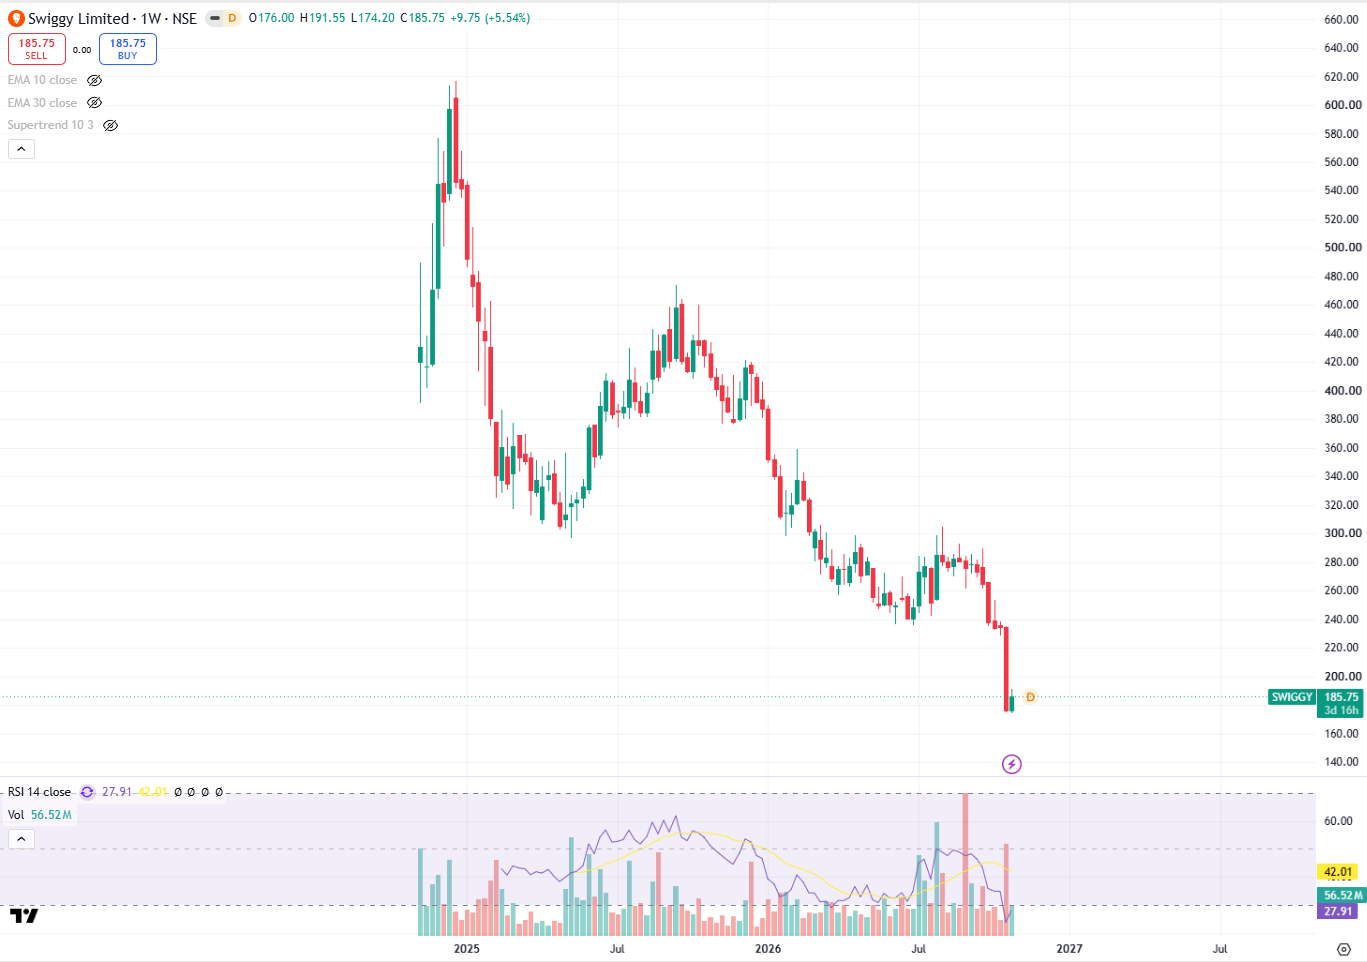
Weekly charts from TradingView, NSE, October 26, 2026. Averages and RSI are computed from daily closes.
Conclusion
- Eternal makes money in both food delivery and quick commerce, and Blinkit's profit drove a 197% jump in adjusted EBITDA.
- Swiggy's food business is improving, with a record 3.4% margin. But Instamart's Rs 895 Cr loss keeps the group loss-making, and Instamart is losing share.
- The market prices this gap: 2.1x yearly order value for Eternal against 0.45x for Swiggy.
- Brokerages see 20% average upside for Eternal and 41% for Swiggy, but their targets vary widely for both.
- Q3 will show whether Instamart's losses have really peaked and whether Blinkit's margin keeps rising as it opens about 750 stores.
This analysis is for educational purposes only and does not constitute investment advice.
Sources
- Eternal Q2 FY27 shareholders' letter (October 21, 2026) and Swiggy Q2 FY27 shareholders' letter (October 22, 2026)
- Screener: Eternal and Screener: Swiggy: market cap, ratios and the last 12 months' figures
- Brokerage, estimate and competition sources are linked in the notes above
For other companies' results, see the results hub.
Disclaimer: This post is for informational and educational purposes only. It does not constitute investment advice. Please consult your financial advisor before making any investment decisions.
- #Eternal
- #Zomato
- #Swiggy
- #Blinkit
- #Instamart
- #Eternal vs Swiggy
- #Blinkit vs Instamart
- #Quick Commerce
- #Food Delivery
- #Q2 FY27 Results
- #Adjusted EBITDA
- #Net Order Value
- #Dark Stores
- #Zepto
- #Analyst Targets
- #Valuation Ratios
- #Quarterly Earnings
- #Earnings Analysis
- #Technical Analysis
- #Stock Comparison
- #Fundamental Analysis
- #Investing
- #EternalVsSwiggy
- #Q2FY27Results
- #QuickCommerce
Frequently asked questions
Is Eternal profitable?
Yes. Eternal reported a Q2 FY27 net profit of Rs 125 Cr and adjusted EBITDA of Rs 666 Cr. Food delivery (Zomato) earned Rs 627 Cr and Blinkit Rs 184 Cr of adjusted EBITDA.
Why did Swiggy shares fall after the Q2 FY27 results?
Instamart's adjusted EBITDA loss rose to Rs 895 Cr and the net loss to Rs 922 Cr, about 6% worse than expected. Brokerages cut their targets, and the stock fell 16.7% on October 23, 2026 to a record low.
Which is bigger, Blinkit or Instamart?
Blinkit. In Q2 FY27 its net order value was Rs 20,940 Cr against Rs 6,594 Cr for Instamart, about 3.2 times. Blinkit had 2,751 dark stores and Instamart 1,240.
What are the analyst targets for Eternal and Swiggy?
After the Q2 FY27 results, eight Eternal targets averaged Rs 390, 19.8% above the October 26 close of Rs 325.55. Seven Swiggy targets averaged about Rs 262, 41% above Rs 185.75, with a range of Rs 200 to Rs 400.
Related articles

Investing11 min read

Investing12 min read

Investing10 min read
Stay ahead on finance & AI
Weekly articles on personal finance, investing strategies, and how AI is changing the way we manage money. Free. No spam.
Join free · Unsubscribe anytime · We never share your email.