LTM vs LTTS: Q2 FY27 Results, Valuation and Outlook
LTM (LTIMindtree) vs L&T Technology Services Q2 FY27: growth, margins, P/E, brokerage targets and outlook. LTM trades at 22.6x earnings, LTTS at 27.5x.
· 11 min read
LTM (formerly LTIMindtree) and L&T Technology Services (LTTS) are two L&T group companies. LTM reported its Q2 FY27 results on October 16, 2026, and LTTS on October 19.
In short: both grew about 5% in constant currency. LTTS widened its margin to 16.3% and grew continuing profit 19.7%. LTM's profit was flat and its orders fell 21%. LTM is the cheaper stock, at 22.6x earnings against 27.5x for LTTS. This post compares the numbers. It does not tell you which to buy.
Prices are the NSE close on October 19, 2026.
What Do LTM and LTTS Do?
LTM is an IT services company. It builds and runs software, cloud, and AI systems for banks, retailers, and manufacturers, mostly in the US. It has 88,835 employees.
LTTS is an engineering services company. It designs and tests cars, aircraft, medical devices, and plants for its customers. It has 24,035 employees, and its revenue is about a quarter of LTM's. Larsen & Toubro owns 68.5% of LTM and 73.5% of LTTS.
Q2 FY27 Results Side by Side
| Metric | LTM | LTTS |
|---|---|---|
| Revenue | Rs 11,808 Cr | Rs 3,040 Cr |
| Growth in rupees (YoY) | +13.6% | +12.1% |
| Growth in dollars, constant currency (YoY) | +5.1% | +4.8% |
| EBIT margin | 15.6% | 16.3% |
| EBIT margin change (YoY) | −30 bps | +220 bps |
| Net profit | Rs 1,380 Cr | Rs 380 Cr |
| Net profit change (YoY) | −0.1% | +19.7% |
| EPS (basic) | Rs 47.2 | Rs 35.78 |
| Interim dividend | Rs 25 | Rs 20 |
LTTS figures are for continuing operations, because it sold its SWC business on September 1, 2026. Its reported net income was Rs 548 Cr (up 66.8%), which includes a one-time gain of Rs 165 Cr. Some news reports quote LTM's profit as Rs 1,398 Cr. This post uses Rs 1,380 Cr from the company's investor release.
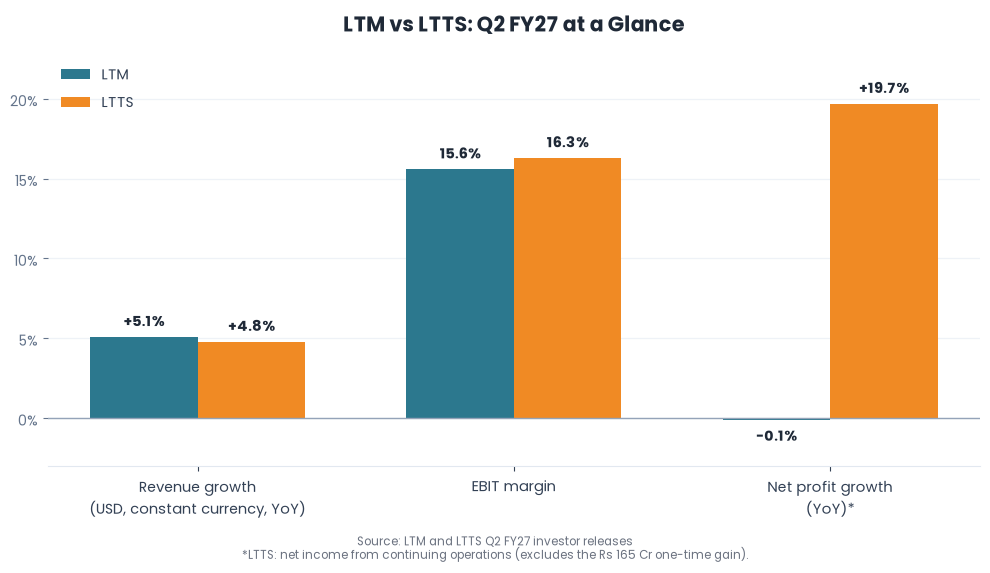
The weaker rupee did most of the work. Both companies grew 12–14% in rupees, but the rupee was about 8.5% weaker than a year ago. In dollars, at constant currency, growth was 5.1% for LTM and 4.8% for LTTS. So revenue does not separate them. Margins, profit, orders, and cash flow do.
LTM: Flat Profit, Fewer Orders
- Profit: EBIT rose 11.5% to Rs 1,838 Cr, but net profit was flat at Rs 1,380 Cr. A forex loss of Rs 207 Cr (against a Rs 65 Cr gain a year earlier) absorbed the gain.
- Orders: Order inflow fell 21% to $1.26 billion. Management says it is moving to AI deals, which are shorter and turn into revenue faster. Inflow over the last 12 months, $6.32 billion, is still 1.3 times revenue.
- Cash: Free cash flow fell 67% to Rs 329 Cr because working capital absorbed Rs 709 Cr. Cash and investments are Rs 15,300 Cr.
- Weak spot: Financial services, 34.7% of revenue, grew only 0.4% year over year in constant currency.
LTTS: Margin Up, but Read the Profit Line
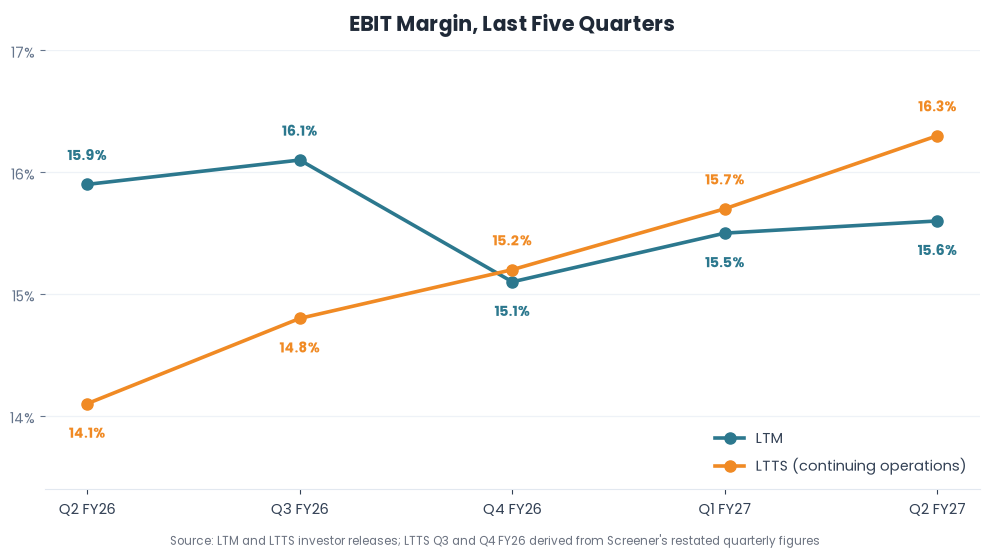
- Margin: EBIT margin reached 16.3%, up 60 bps from the previous quarter. Management hit its mid-16% target early. The margin has risen four quarters in a row.
- Profit: The 66.8% headline growth includes the one-time gain. Continuing net income was Rs 380 Cr, up 19.7%.
- Segments: Sustainability, 38% of revenue, grew 13.4% and earns about 55% of segment profit. Tech fell 8.5%, and Europe fell 3.9%.
- Deals: Large-deal wins topped $200 million, and more than half were AI-related.
Market Expectations vs Reality
| Estimate | Actual | Reading | |
|---|---|---|---|
| LTM revenue | Rs 11,787 Cr | Rs 11,808 Cr | Narrow beat |
| LTM net profit | Rs 1,494 Cr | Rs 1,398 Cr | About 6% short |
| LTTS EPS (continuing) | Rs 35.21 | Rs 35.78 | Slightly ahead |
Sources: IndiaIPO (LTM) and Investing.com (LTTS).
LTM fell 2.85% to Rs 4,264.90 on October 19, the first session after its results. LTTS closed at Rs 3,611.30 (down 2.78%) on the day it reported, so its reaction to the numbers is not clear yet.
What Does Management Expect?
| LTM | LTTS | |
|---|---|---|
| Revenue | FY27 growth close to FY26's (about 5.3%), with H2 better than H1 | Stronger momentum in H2 |
| Margin | Near last year's level (about 15.4%) | Mid-16%, despite a 50–80 bps wage hit in Q3 |
| Longer term | No multi-year target | 13–15% revenue growth a year and a 16–17% margin over five years |
LTTS's five-year goal compares with 4.8% growth today, so it needs a sharp pick-up. LTM has also offered to buy Randstad's technology consulting business in Europe and Australia, which has more than $500 million of annual revenue. The deal needs regulatory approval.
Sources: GuruFocus (LTM call), LTTS investor release, and LTM's Randstad announcement. These are management statements, not guarantees.
Valuation: Which One Looks Cheaper?
| Metric | LTM | LTTS |
|---|---|---|
| Price | Rs 4,264.90 | Rs 3,611.30 |
| Market cap | Rs 1,26,650 Cr | Rs 38,336 Cr |
| P/E | 22.6x | 27.5x |
| P/B | 4.9x | 5.4x |
| EV/EBIT | 15.7x | 18.9x |
| Dividend yield | 1.76% | 1.61% |
| H1 EPS growth (YoY) | +7.8% | +18.4% |
| P/E divided by H1 EPS growth | about 2.9 | about 1.5 |
| Price vs 52-week high | −33.7% | −23.9% |
Price, P/E, yield, and 52-week range are from Screener. EV/EBIT is market cap minus cash and investments, divided by trailing EBIT (Rs 7,084 Cr for LTM, Rs 1,805 Cr for LTTS). Trailing EPS excludes one-offs. The growth rows look backward and are not forecasts.
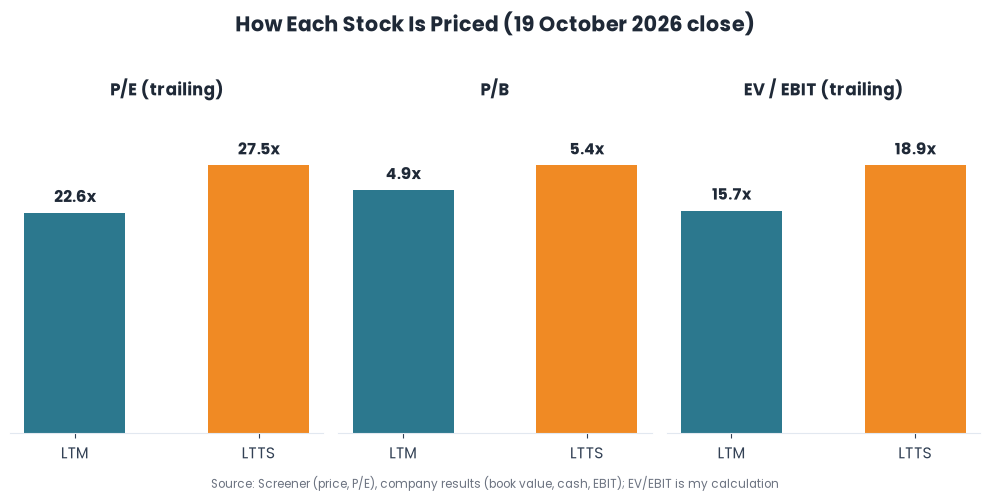
LTM is cheaper on every measure. LTTS's premium pays for faster profit growth and a rising margin, but only if that growth continues. Both trade above TCS (16.3x), Infosys (14.7x), HCL Tech (19.7x), and Wipro (13.7x).
What Do Brokerages Say?
| Brokerage | Rating | Target | Upside |
|---|---|---|---|
| Anand Rathi | Buy | Rs 5,125 | +20.2% |
| Motilal Oswal | Buy | Rs 5,050 | +18.4% |
| Axis Securities | Buy | Rs 4,960 | +16.3% |
| Nomura | Neutral (cut from Buy) | Rs 4,410 | +3.4% |
Four LTM notes published after the results; upside is from the Rs 4,264.90 close. Sources: IndiaIPO, Whalesbook (Axis), Whalesbook (Anand Rathi).
The average target is about Rs 4,886, which is 14.6% above the price. Nomura cut its rating because of valuation. LTTS reported today, so brokerages have not yet published new targets after its Q2 results. The latest consensus, from MarketScreener, predates the results: 31 analysts, a Hold rating, and an average target of Rs 3,577, about the current price.
What Do the Weekly Charts Say?
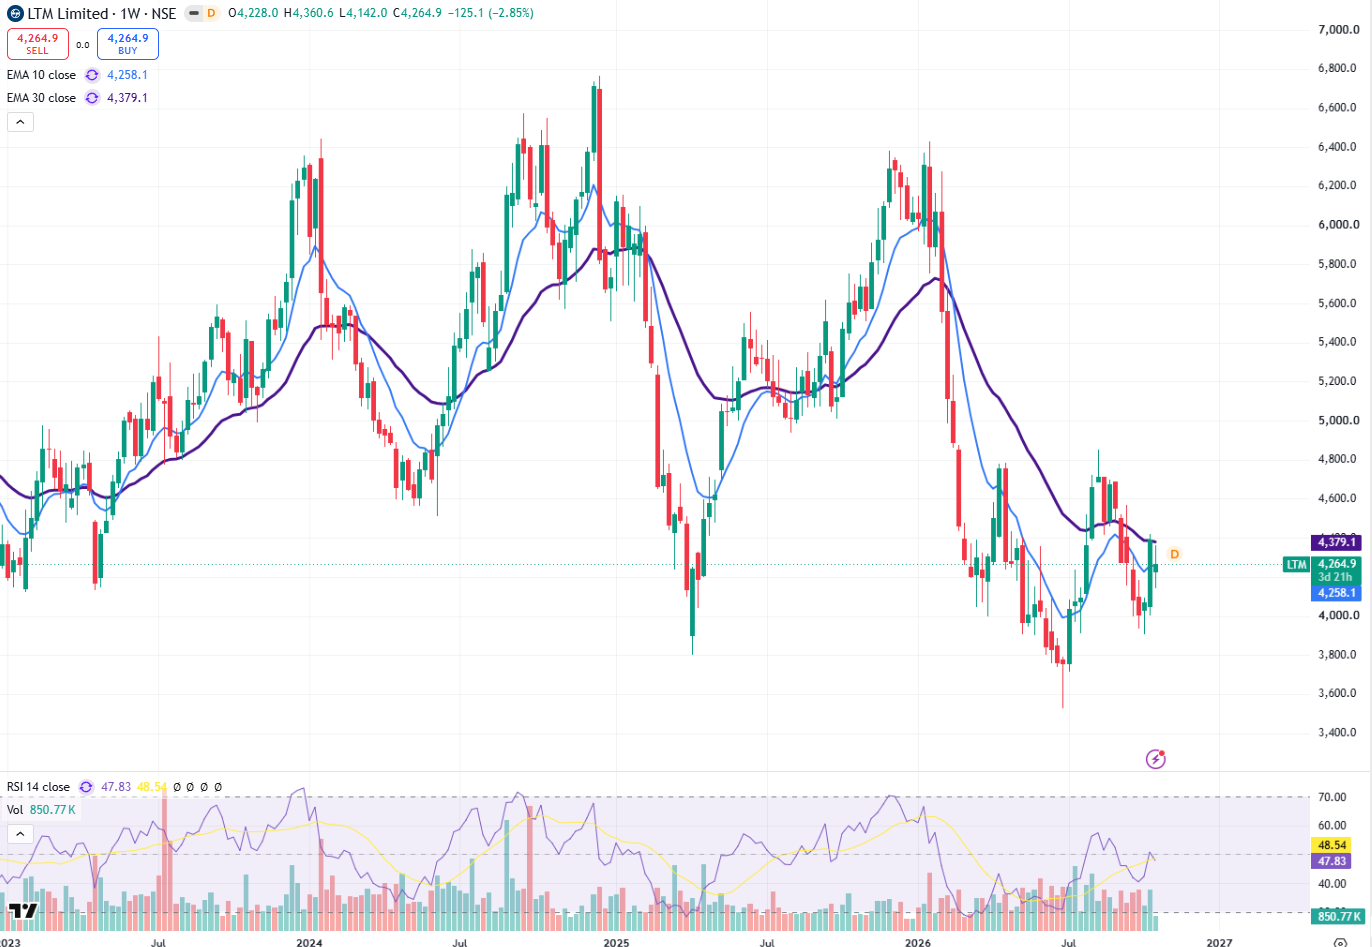
Both weekly bars cover only Monday, October 19.
LTM is 34% below its 52-week high of Rs 6,430 and 21% above its 2026 low of Rs 3,528. It trades between its 10-week average (Rs 4,258) and 30-week average (Rs 4,379).
LTTS is 24% below its 52-week high of Rs 4,747 and 20% above its 2026 low of Rs 3,010. It trades above its 10-week (Rs 3,456) and 30-week (Rs 3,501) averages.
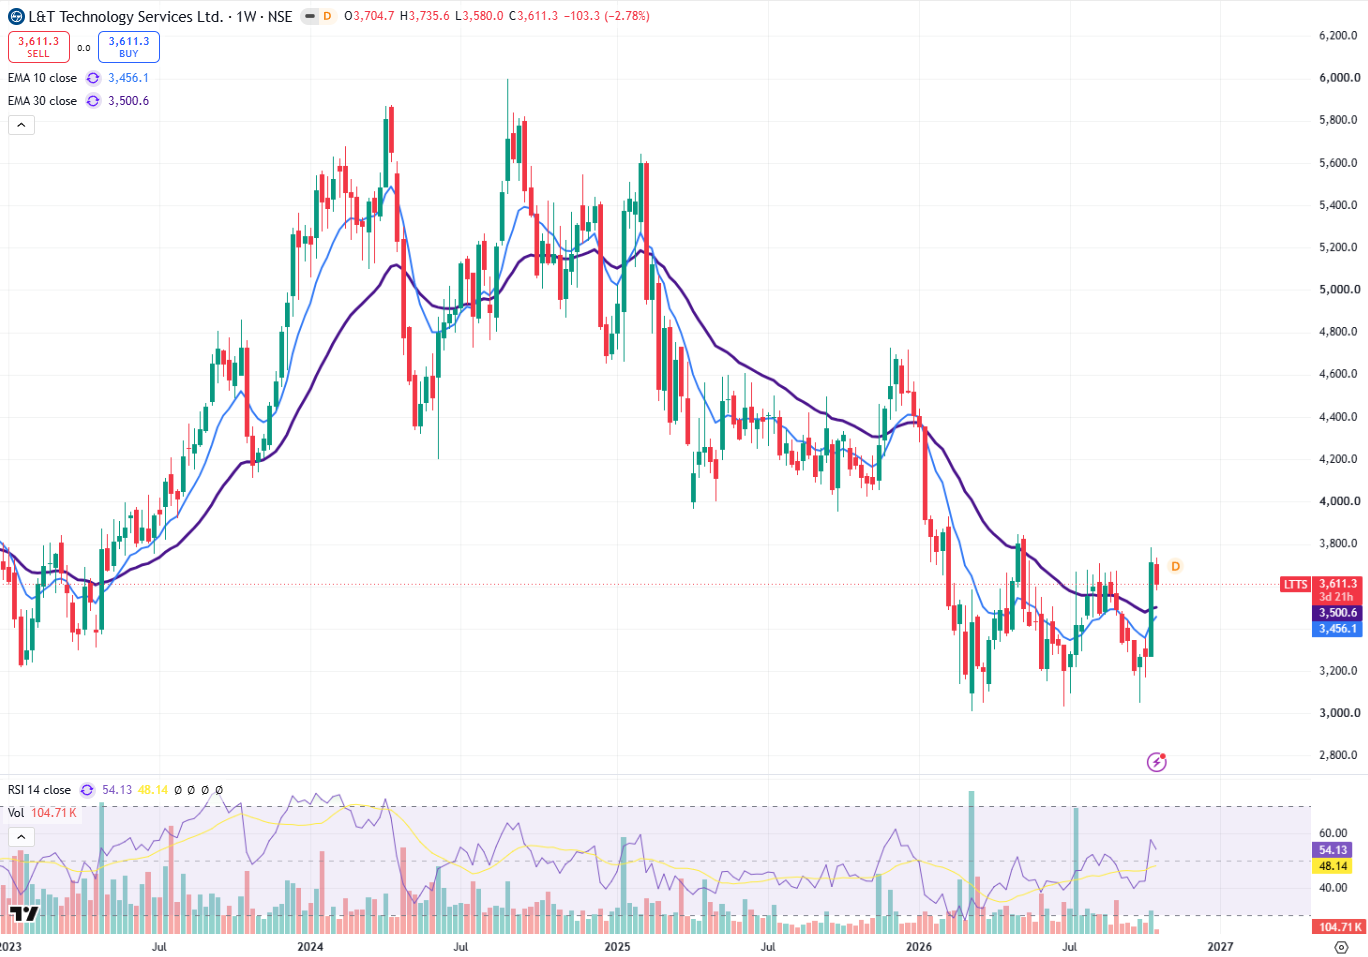
Weekly charts from TradingView, NSE, October 19, 2026.
Conclusion
- LTM is the cheaper stock (22.6x earnings against 27.5x), and three of the four post-result brokerage notes are Buy.
- But its profit is flat, orders and cash flow fell, and management expects growth close to last year's 5%.
- LTTS has the stronger momentum: a rising margin, 19.7% continuing profit growth, and large-deal wins.
- It costs about 22% more per rupee of earnings, its headline profit includes a one-time gain, and Tech, Europe, and Q3 wage hikes are ahead.
- The Q3 results in January will show whether LTTS keeps growing and whether LTM's profit recovers.
This analysis is for educational purposes only and does not constitute investment advice.
Sources
- LTM investor relations and LTTS investor relations — Q2 FY27 results (October 16 and 19, 2026)
- Screener: LTM and Screener: LTTS — prices, ratios, quarterly history (October 19, 2026)
- Brokerage and call sources are linked in the notes above
For other IT companies, see TCS vs Infosys vs HCL vs Wipro.
Disclaimer: This post is for informational and educational purposes only. It does not constitute investment advice. Please consult your financial advisor before making any investment decisions.
- #LTM
- #LTIMindtree
- #LTTS
- #L&T Technology Services
- #LTM vs LTTS
- #L&T Group
- #Q2 FY27 Results
- #IT Stocks Comparison
- #IT Stocks
- #Indian IT Stocks
- #Engineering R&D Services
- #Engineering Intelligence
- #AI Revenue
- #Order Inflow
- #PE Ratio
- #PB Ratio
- #EV/EBIT
- #Valuation Ratios
- #EBIT Margin
- #Analyst Targets
- #Quarterly Earnings
- #Earnings Analysis
- #Nifty IT
- #Fundamental Analysis
- #Stock Comparison
- #Investing
- #LTMvsLTTS
- #Q2FY27Results
- #ITStocks
Frequently asked questions
Which is cheaper, LTM or LTTS?
LTM. It trades at 22.6x earnings against 27.5x for LTTS. LTTS costs about 22% more per rupee of earnings, but its continuing profit grew 19.7% in Q2 while LTM's was flat.
Did LTTS profit really grow 66.8% in Q2 FY27?
Only on the headline. Reported net income includes a one-time gain of Rs 165 Cr. Net income from continuing operations was Rs 380 Cr, up 19.7%.
Is LTM the same company as LTIMindtree?
Yes. LTM Limited is the new name of LTIMindtree Limited. LTTS (L&T Technology Services) is a separate listed company in the same group.
Related articles

Investing10 min read

Investing14 min read

Investing14 min read
Stay ahead on finance & AI
Weekly articles on personal finance, investing strategies, and how AI is changing the way we manage money. Free. No spam.
Join free · Unsubscribe anytime · We never share your email.